By Michael Marsh
Another weekend of referendums is now over and the debate is well under way as to what the result means: what did the people say when they spoke? We have various evidence to go on: the polls, anecdotal evidence, and the nature of the campaign itself, but all these are flawed. The polls after all were ‘wrong’, or at least did not provide any simple indication of what would happen and so the ‘intentions’ voiced in the polls may diverge from the reality of what people did. Anecdotes are just that, often chosen to fit an argument rather that employed to test one. And the campaign themes themselves are not necessarily those that motivated most voters to pick yes, no, or indeed to switch off.
What we do have that is concrete is the results themselves. These are available only at constituency level but it does allow us to look at patterns of voting and non-voting and think about some of the points now raised in the aftermath.
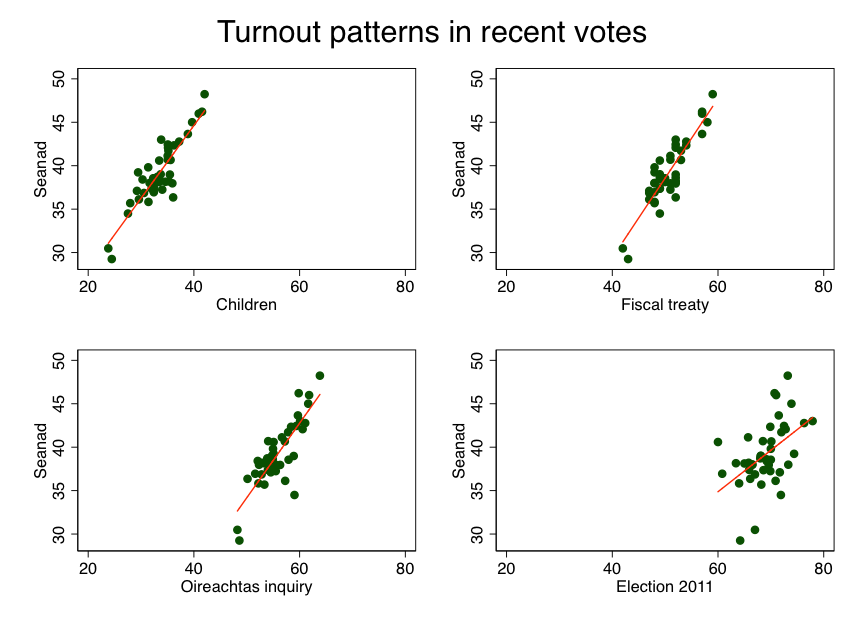
First we can look at turnout. This was low, and low even by the standards of referendums. But who voted, and who did not? Figure 1 shows the correspondence between voting in this referendum and some previous ones, and between the turnout last week and turnout in the 2011 general election. In each case the graph shows turnout in each constituency in each of two votes. The red line simply summarises the pattern of the dots, showing an upward or downward trend, or no trend at all. In the case of turnout the picture is clear. Turnout was high last week where it is usually high in referendums; it was low where it is typically low. In other words, the pattern of turnout – whatever about the overall level – was as we might expect. It did differ from the 2011 election. This is also normal, and is probably due to the impact of turnout of party and candidate organisations that are absent in referendums.
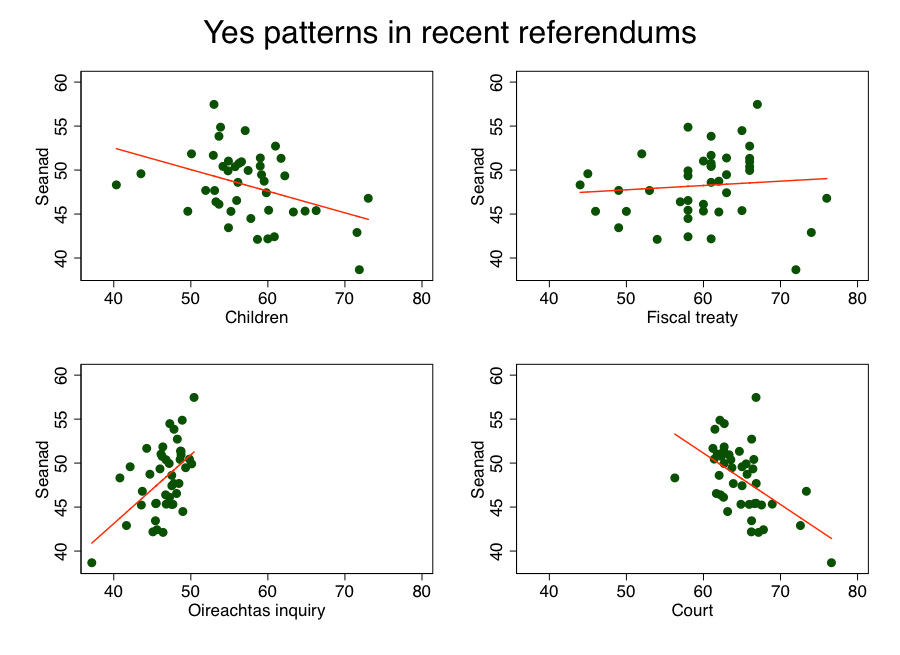
Second we can look at areas that supported a yes vote in Figure 2. Again, this shows the correspondence between voting yes in this referendum and voting yes in other recent referendums. What this shows is that there really is no pattern. Votes to abolish the Seanad were higher in places where votes to extend the rights are children got less support; votes to abolish the Seanad were not associated at all with votes to approve the Fiscal Treaty; votes to abolish the Seanad were positively associated with votes to give the Oireachtas more powers of inquiry – arguably a consistent position. Most interest is that approval of the move to abolish the Seanad was linked with much less support for a new Court, so areas that were more likely to reject one of the propositions were more likely to accept the other. This at least gives us reason to reconsider one interpretation of the Seanad vote as simply a kick against the government.
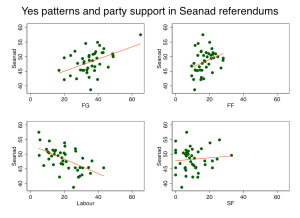
One difference between recent referendums has been the line of parties calling for a yes and no. All supported the Children’s referendum, if not equally vociferously, but Sinn Féin opposed the Fiscal Treaty and Fianna Fáil opposed abolition of the Seanad. How far is party support in an area associated with that party’s position? Figure 3 shows us. Support for the proposition to abolish the Seanad was stronger where FG was stronger, with Mayo top of the class on both measures. Oddly enough, perhaps, this is also true, though less clearly for FF. While the party advocated a no vote, the yes vote was higher where the party was most strong. Sinn Féin, for once siding with the government, advocated a yes vote, but there is no sign of any effect on its supporters with areas of strong and weak SF support equally likely to vote yes. The most interesting and strongest link with the yes vote is the 2011 strength of Labour. Where it was strongest the no vote was highest!
It should be said that all of these associations do not necessarily indicate cause, and it is certainly not possible to infer that Labour supporters voted no, but the association is clear and if erstwhile Labour voters were not more inclined to vote no than some other factor is required to explain that pattern. Even if we take the strength of al other parties into account and the very significant association between Labour support in 2011 and the no vote here remains. Pat Rabbitte was very quick to see this as a vote to reform the Seanad and place his party in the vanguard of such a movement. Perhaps he knew something that most commentators did not.