Adrian Kavanagh, 14th September 2013
The most recent Sunday Independent-Millward Brown poll (13th October) brought some relatively disappointing news for the government parties, with both losing a percentage point relatively to the previous such poll of 29th September, with the most significant trend being a three percentage points gain by the Independents and Others political grouping. The latest Millward Brown poll estimates party support levels as: Fine Gael 27% (down 1%), Fianna Fail 27% (NC), Sinn Fein 19% (NC), Labour 9% (down 1%), Green Party 1% (NC), Independents and Others 17% (up 3%). My constituency-level analysis of these poll figures estimates that party seat levels, if these national support trends were replicated in an actual general election, would be as follows: Fianna Fail 51, Fine Gael 50, Sinn Fein 25, Labour 8, Green Party 0, Independents and Others 24.
The latest Irish Times-Ipsos MRBI poll (1st October 2013) has brought very bad news for the Labour Party, with that party’s poll levels shown to be at their lowest in such polls over a period of 25 years. The poll, by contrast, offers better news for Labour’s coalition partners, Fine Gael, who gain some percentage points to overtake Fianna Fail, as also does Sinn Fein. The poll estimates party support as follows (and relative to the previous such Ipsos MRBI poll of June 2013): Fine Gael 26% (up 2%), Fianna Fail 22% (down 4%), Sinn Fein 23% (up 2%), Labour 6% (down 2%), Green Party 2% (NC), Independents and Others 21% (up 3%). My constituency-level analysis of these poll figures estimates that party seat levels, should such national support trends be replicated in an actual general election, would be as follows: Fianna Fail 39, Fine Gael 54, Sinn Fein 38, Labour 0, Green Party 0, Independents and Others 27.
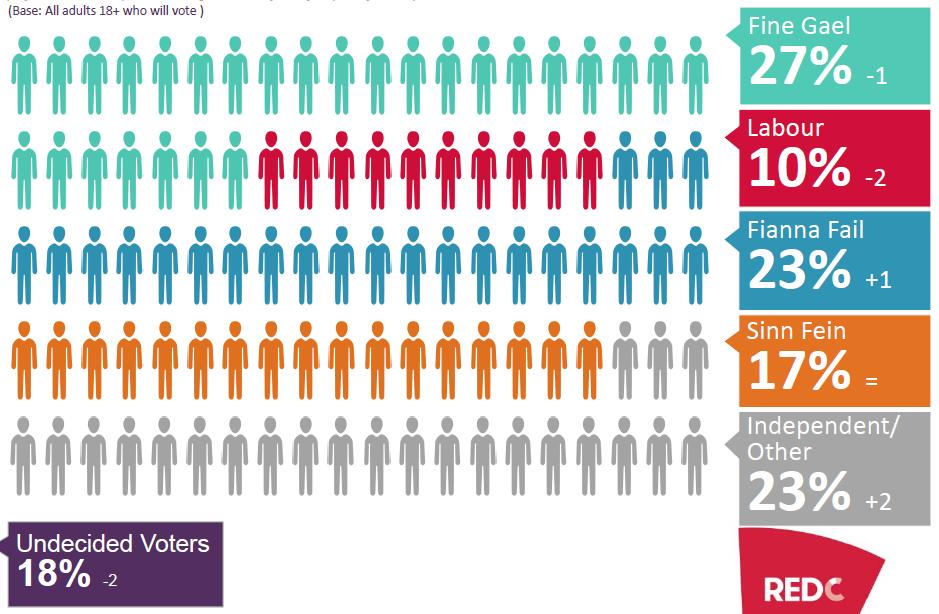
With a new Dail term about to commence, the Sunday Business Post-Red C poll of 15th September 2013 made for some uncomfortable reading for the government parties who both lost some ground relative to the previous such poll, while Fianna Fail and the Independents/other smaller parties grouping have made up some ground: Fine Gael 27% (down 1%), Fianna Fail 23% (up 1%), Sinn Fein 17% (NC), Labour 10% (down 2%), Green Party 4% (up 2%), Independents and Others 19% (NC). My constituency-level analysis of these poll figures estimates that party seat levels, should such national support trends be replicated in an actual general election, would be as follows: Fianna Fail 44, Fine Gael 53, Sinn Fein 22, Labour 12, Green Party 3, Independents and Others 24. The Sunday Times-Behaviour & Attitudes poll (22nd September 2013) does offer some good news for Labour, with that party shown to increase by four percentage points on the previous such poll: Fine Gael 25% (down 2%), Fianna Fail 21% (down 3%), Sinn Fein 18% (up 2%), Labour 11% (up 4%), Green Party 3% (NC), Independents and Others 23% (NC). My constituency-level analysis of these poll figures estimates that party seat levels, should such national support trends be replicated in an actual general election, would be as follows: Fianna Fail 39, Fine Gael 51, Sinn Fein 26, Labour 13, Green Party 1, Independents and Others 28. The Sunday Independent-Millward Brown poll similarly brought some relatively good news for the government parties, with both making gains relative to the previous such poll in addition to Fianna Fail. The Sunday Independent-Millward Brown poll (29th September) estimates party support levels as: Fine Gael 28% (up 1%), Fianna Fail 27% (up 2%), Sinn Fein 19% (down 2%), Labour 10% (up 2%), Green Party 1% (down 1%), Independents and Others 14% (down 2%). My constituency-level analysis of these poll figures estimates that party seat levels, if these national support trends were replicated in an actual general election, would be as follows: Fianna Fail 51, Fine Gael 53, Sinn Fein 26, Labour 11, Green Party 0, Independents and Others 17.
The analyses used here are similar to previous posts which have applied a constituency level analysis (although with these using the constituency units used for the 2011 General Election) based on assigning seats on the basis of constituency support estimates and simply using a d’Hondt method to determine which party wins the seats, while also taking account of the factors of vote transfers and vote splitting/management (based on vote transfer/management patterns observed in the February 2011 election). Based on such an analysis and using the new constituency units (as defined in the 2012 Constituency Commission report) – the new constituencies which will be used for the next general election (assuming an election is not called in the following months before the Electoral Act putting the new constituency configuration into effect) – these analyses estimates what party seat levels would be, should such national support trends be replicated in an actual general election. These analysis suggests that Fianna Fail would seem to be the party most likely to be positively effected by the redrawing of the constituency boundaries and suggests that the party, in this context, would be gaining as a result of the boundary changes, in addition to the party’s improvement in its opinion poll levels relative to its 2011 General Election figures, irrespective of the impact of a reduction in Dail seat numbers from 166 to 158. Due to unusually high/low support levels for some parties or political groupings in the previous election, the model may throw up occasional constituency predictions that are unlikely to pan out in a “real election”, but the estimates here cannot be seen as highly accurate estimates of support levels at the constituency level as in a “real election” party support changes will vary significantly across constituency given uneven geographical shifts in support levels. But the ultimate aim of the models are to get an overall, national-level, estimate of seat numbers and these are based on the proviso that an over-prediction in one constituency may be offset by an under-prediction in another constituency. I have made some further corrections to the base support figures for the different parties for this analysis to take better account of the impacts on support of the 2012 Constituency Commission report boundary changes with especial reference to the Dublin constituencies. For instance, these figures better reflect the weaker positions of Fine Gael and Fianna Fail in Dublin Central after the moving out of the Ashtown area to Dublin West and the Botanic/Drumcondra area to Dublin North West, but also their stronger positions in Dublin West and Dublin North West. Fine Gael are assigned an extra seat in Dun Laoghaire on the basis that the Ceann Comhairle, Sean Barrett, will be automatically returned at the next general election and this constituency will effectively be rendered a three-seat contest at the next general election.
**************************
The constituency support estimates based on the Irish Times-Ipsos MRBI poll figures (1st October 2013), when using the new constituency units (as used for the next general election), are as follows:
| FF | FG | LB | SF | OTH | GP | |
| Carlow-Kilkenny | 36% | 29% | 5% | 22% | 6% | 3% |
| Cavan-Monaghan | 19% | 22% | 1% | 48% | 8% | 1% |
| Clare | 28% | 31% | 5% | 8% | 26% | 2% |
| Cork East | 24% | 30% | 11% | 28% | 5% | 1% |
| Cork North Central | 19% | 19% | 8% | 32% | 21% | 1% |
| Cork North West | 34% | 37% | 5% | 18% | 5% | 2% |
| Cork South Central | 36% | 25% | 6% | 19% | 11% | 3% |
| Cork South West | 32% | 37% | 5% | 17% | 7% | 2% |
| Donegal | 19% | 13% | 2% | 48% | 17% | 1% |
| Dublin Central | 14% | 10% | 8% | 33% | 32% | 2% |
| Dublin Mid West | 16% | 24% | 10% | 29% | 17% | 4% |
| Dublin Fingal | 22% | 26% | 9% | 7% | 27% | 10% |
| Dublin Bay North | 16% | 26% | 10% | 23% | 23% | 2% |
| Dublin North West | 17% | 14% | 13% | 45% | 10% | 1% |
| Dublin Rathdown | 13% | 28% | 5% | 6% | 40% | 8% |
| Dublin South Central | 12% | 16% | 12% | 34% | 25% | 2% |
| Dublin Bay South | 16% | 30% | 9% | 10% | 26% | 8% |
| Dublin South West | 14% | 23% | 11% | 30% | 19% | 3% |
| Dublin West | 24% | 21% | 9% | 15% | 29% | 2% |
| Dun Laoghaire | 22% | 30% | 10% | 6% | 27% | 5% |
| Galway East | 23% | 32% | 5% | 12% | 27% | 1% |
| Galway West | 24% | 24% | 3% | 13% | 34% | 2% |
| Kerry County | 14% | 23% | 5% | 24% | 34% | 1% |
| Kildare North | 21% | 28% | 10% | 14% | 25% | 2% |
| Kildare South | 30% | 27% | 10% | 15% | 16% | 2% |
| Laois | 33% | 25% | 4% | 29% | 8% | 0% |
| Offaly | 27% | 18% | 1% | 13% | 41% | 0% |
| Limerick City | 31% | 34% | 7% | 19% | 7% | 1% |
| Limerick | 27% | 41% | 5% | 9% | 17% | 1% |
| Longford-Westmeath | 28% | 31% | 9% | 19% | 12% | 1% |
| Louth | 18% | 20% | 5% | 43% | 9% | 5% |
| Mayo | 22% | 48% | 2% | 16% | 11% | 0% |
| Meath East | 26% | 31% | 7% | 21% | 13% | 1% |
| Meath West | 22% | 31% | 4% | 37% | 5% | 1% |
| Roscommon-Galway | 17% | 29% | 3% | 13% | 38% | 0% |
| Sligo-Leitrim | 26% | 23% | 2% | 35% | 14% | 1% |
| Tipperary | 18% | 20% | 5% | 12% | 45% | 1% |
| Waterford | 18% | 28% | 6% | 22% | 25% | 1% |
| Wexford | 24% | 26% | 7% | 13% | 29% | 1% |
| Wicklow | 13% | 28% | 5% | 22% | 29% | 2% |
Based on these constituency estimates and using a d’Hondt method to determine which party wins the seats in a constituency, the party seat levels are estimated as follows:
| FF | FG | LB | SF | OTH | GP | |
| Carlow-Kilkenny | 2 | 2 | 0 | 1 | 0 | 0 |
| Cavan-Monaghan | 1 | 1 | 0 | 2 | 0 | 0 |
| Clare | 1 | 2 | 0 | 0 | 1 | 0 |
| Cork East | 1 | 2 | 0 | 1 | 0 | 0 |
| Cork North Central | 1 | 1 | 0 | 1 | 1 | 0 |
| Cork North West | 1 | 2 | 0 | 0 | 0 | 0 |
| Cork South Central | 2 | 1 | 0 | 1 | 0 | 0 |
| Cork South West | 1 | 2 | 0 | 0 | 0 | 0 |
| Donegal | 1 | 0 | 0 | 3 | 1 | 0 |
| Dublin Central | 0 | 0 | 0 | 2 | 1 | 0 |
| Dublin Mid West | 1 | 1 | 0 | 1 | 1 | 0 |
| Dublin Fingal | 1 | 2 | 0 | 0 | 2 | 0 |
| Dublin Bay North | 1 | 2 | 0 | 1 | 1 | 0 |
| Dublin North West | 1 | 0 | 0 | 2 | 0 | 0 |
| Dublin Rathdown | 0 | 1 | 0 | 0 | 2 | 0 |
| Dublin South Central | 0 | 1 | 0 | 2 | 1 | 0 |
| Dublin Bay South | 1 | 2 | 0 | 0 | 1 | 0 |
| Dublin South West | 1 | 1 | 0 | 2 | 1 | 0 |
| Dublin West | 1 | 1 | 0 | 1 | 1 | 0 |
| Dun Laoghaire | 1 | 2 | 0 | 0 | 1 | 0 |
| Galway East | 1 | 1 | 0 | 0 | 1 | 0 |
| Galway West | 2 | 1 | 0 | 0 | 2 | 0 |
| Kerry County | 1 | 1 | 0 | 1 | 2 | 0 |
| Kildare North | 1 | 1 | 0 | 1 | 1 | 0 |
| Kildare South | 1 | 1 | 0 | 1 | 0 | 0 |
| Laois | 1 | 1 | 0 | 1 | 0 | 0 |
| Offaly | 1 | 0 | 0 | 0 | 2 | 0 |
| Limerick City | 1 | 2 | 0 | 1 | 0 | 0 |
| Limerick | 1 | 2 | 0 | 0 | 0 | 0 |
| Longford-Westmeath | 1 | 2 | 0 | 1 | 0 | 0 |
| Louth | 1 | 1 | 0 | 3 | 0 | 0 |
| Mayo | 1 | 3 | 0 | 0 | 0 | 0 |
| Meath East | 1 | 1 | 0 | 1 | 0 | 0 |
| Meath West | 1 | 1 | 0 | 1 | 0 | 0 |
| Roscommon-Galway | 0 | 1 | 0 | 0 | 2 | 0 |
| Sligo-Leitrim | 1 | 1 | 0 | 2 | 0 | 0 |
| Tipperary | 1 | 1 | 0 | 0 | 3 | 0 |
| Waterford | 1 | 1 | 0 | 1 | 1 | 0 |
| Wexford | 1 | 2 | 0 | 1 | 2 | 0 |
| Wicklow | 0 | 2 | 0 | 1 | 2 | 0 |
| STATE | 38 | 52 | 0 | 36 | 33 | 0 |
These estimates also need to take account of the candidate and competition trends unique to the different constituency. Amending the model to account for seats that may be won or lost on the basis of estimates here being based on support levels derived due to a large/small number of candidates contesting the election in 2011 (as in the large number of independent candidates competing in constituencies such as Wicklow or Laois-Offaly in 2011) or one candidate polling especially well in that election (e.g. the Shane Ross vote in Dublin South/Mick Wallace vote in Wexford) in a manner that would not amount to an extra seat for another member of the same party/grouping. Vote transfer patterns and vote management issues (e.g. discrepancies between votes won by party front runners and their running mates which would see potential seat wins fall out of a party’s hands) also need to be accounted for. Taking these concerns into account, the amended seat allocations across the constituencies would look more like this:
| FF | FG | LB | SF | OTH | GP | |
| Carlow-Kilkenny | 2 | 2 | 0 | 1 | 0 | 0 |
| Cavan-Monaghan | 1 | 1 | 0 | 2 | 0 | 0 |
| Clare | 1 | 2 | 0 | 0 | 1 | 0 |
| Cork East | 1 | 2 | 0 | 1 | 0 | 0 |
| Cork North Central | 1 | 1 | 0 | 2 | 0 | 0 |
| Cork North West | 1 | 2 | 0 | 0 | 0 | 0 |
| Cork South Central | 2 | 1 | 0 | 1 | 0 | 0 |
| Cork South West | 1 | 2 | 0 | 0 | 0 | 0 |
| Donegal | 1 | 0 | 0 | 3 | 1 | 0 |
| Dublin Central | 0 | 0 | 0 | 2 | 1 | 0 |
| Dublin Mid West | 1 | 1 | 0 | 2 | 0 | 0 |
| Dublin Fingal | 1 | 2 | 0 | 0 | 2 | 0 |
| Dublin Bay North | 1 | 2 | 0 | 1 | 1 | 0 |
| Dublin North West | 1 | 0 | 0 | 2 | 0 | 0 |
| Dublin Rathdown | 0 | 2 | 0 | 0 | 1 | 0 |
| Dublin South Central | 0 | 1 | 0 | 2 | 1 | 0 |
| Dublin Bay South | 1 | 2 | 0 | 0 | 1 | 0 |
| Dublin South West | 1 | 1 | 0 | 2 | 1 | 0 |
| Dublin West | 1 | 1 | 0 | 1 | 1 | 0 |
| Dun Laoghaire | 1 | 2 | 0 | 0 | 1 | 0 |
| Galway East | 1 | 1 | 0 | 0 | 1 | 0 |
| Galway West | 2 | 1 | 0 | 0 | 2 | 0 |
| Kerry County | 1 | 1 | 0 | 1 | 2 | 0 |
| Kildare North | 1 | 1 | 0 | 1 | 1 | 0 |
| Kildare South | 1 | 1 | 0 | 1 | 0 | 0 |
| Laois | 1 | 1 | 0 | 1 | 0 | 0 |
| Offaly | 1 | 1 | 0 | 0 | 1 | 0 |
| Limerick City | 1 | 2 | 0 | 1 | 0 | 0 |
| Limerick | 1 | 2 | 0 | 0 | 0 | 0 |
| Longford-Westmeath | 1 | 2 | 0 | 1 | 0 | 0 |
| Louth | 1 | 1 | 0 | 3 | 0 | 0 |
| Mayo | 1 | 3 | 0 | 0 | 0 | 0 |
| Meath East | 1 | 1 | 0 | 1 | 0 | 0 |
| Meath West | 1 | 1 | 0 | 1 | 0 | 0 |
| Roscommon-Galway | 0 | 1 | 0 | 0 | 2 | 0 |
| Sligo-Leitrim | 1 | 1 | 0 | 2 | 0 | 0 |
| Tipperary | 1 | 1 | 0 | 0 | 3 | 0 |
| Waterford | 1 | 1 | 0 | 1 | 1 | 0 |
| Wexford | 1 | 2 | 0 | 1 | 1 | 0 |
| Wicklow | 1 | 2 | 0 | 1 | 1 | 0 |
| STATE | 39 | 54 | 0 | 38 | 27 | 0 |
| % seats | 24.7 | 34.2 | 0.0 | 24.1 | 17.1 | 0.0 |
Based on these seat estimates, a Fine Gael-Labour (combined seat level of 54 seats) would fall well short of the number of seats required to form a government (79), but a Fianna Fail-Sinn Fein alliance (combined seat level of 77 seats) would come very close to reaching this level. To have a sufficient number of seats required to command a majority in Dail Eireann (79 seats in a 158 seat Dail, assuming a deputy from another party/grouping takes on the Ceann Comhairle role), a Fianna Fail-Sinn Fein alliance would need the support of two, or more, TDs from the independent ranks or from another political grouping to be able to form a government. A Fine Gael and Sinn Fein pairing would easily exceed the 79-seat level (combined seat level of 92 seats), but such an alliance looks to be unlikely in the present political climate. Ultimately, based on these numbers a Fianna Fail-Fine Gael coalition government would be the only viable two-party coalition and such an alliance would command a very strong Dail majority (with a combined seat level of 93 seats).
Given the improved support levels for Fianna Fail and Sinn Fein relative to the 2011 General Election and figures in earlier (during 2010 and 2011) opinion poll figures, the seat estimates based on this constituency-level analysis still suggest a significant improvement in Fianna Fail and Sinn Fein seat levels relative to those won by these parties and groupings in the 2011 contest (especially given that the fact that there will be eight less seats in the next Dail has been factored into this analysis), effectively pointing to significant gains on the part of the Dail opposition since 2011. The same applies to the Independents and Others, but it is worth noting that, as opposed to the parties, the Independents and Others grouping is a very broad church and includes a range of parties, groups and individuals with very different ideological perspectives, including the Socialist Party and the People Before Profit alliance, as well as left-leaning independents and Fianna Fail-gene pool independents. Looking at the constituencies where this grouping is predicted to win seats in this model, it can be seen that left-leaning parties and independents would take 9 of the 19 seats being assigned to this grouping.
The seat level estimate for Labour is very stark (highlighting the fact that the PR-STV system is proportional, but only to a limited extent). Previous analyses have, moreover, suggested that, especially given the increased competition on the Left from Sinn Fein, other smaller left of centre parties and left-leaning independents, that it will be a struggle for Labour to win seats in most, if not all, constituencies if the party’s national support levels fall below the ten percent level, as has been shown in similar analyses of recent Sunday Independent-Millward Brown and Irish Times-Ipsos MRBI polls. Based on the analysis of this latest Irish Times-Ipsos MRBI poll and other polls covered in this post, Labour would be in serious trouble if their national support levels fall below ten percent as the party is also facing a “perfect storm” from electoral geography and changed competition levels. These factors include the reduction in Dail seat numbers (from 166 to 158) and other changes made to general election boundaries by the 2012 Constituency Commission (which militated against Labour while seeming to advantage other parties, but notably Fianna Fail) as well as the increased competition the party now faces on the Left from Sinn Fein, other smaller left-wing parties and left-of-centre independents, as well as from Fianna Fail. When Labour support levels fell to similarly low levels in the late 1990s and early-to-mid 2000s, the party was in a position to be helped in the 1997, 2002 and 2007 General Elections by transfers from lower placed candidates from the smaller left-wing parties, but on these figures Labour candidates would find themselves polling below candidates from Sinn Fein, the Socialist Party, the Workers and Unemployed Action Group or the People Before Profit Alliance, or left-leaning independents, in a number of constituencies. Instead of being in a position to possibly benefit from vote transfers (which themselves would be likely to dry up in any case), the Labour candidates would now in a number of cases be eliminated before the final count and would be providing the transfers to see candidates from other left-of-centre political groupings over the line. (If we look at the 1987 case study – we see Labour won 6.5% of the vote in the 1987 General Election and won 12 seats, but it is also worth noting that they did not contest nine constituencies in that election, whereas their 7% national vote is being distributed across all forty constituencies in this analysis, as with the most recent general elections in which Labour has contested all constituencies. In two of the twelve constituencies in 1987 where Labour won seats – Dublin South-Central, Dublin South-West, Galway West and Wexford – vote transfers were crucial in ensuring Labour won these these seats – i.e. Labour candidates were outside the seat positions on the first count but overtook candidates with higher first preference votes as counts progressed due to transfers from other candidates.
| Constituency | FPV | Total Poll | Quota | % FPV | Lab/quota |
| Carlow-Kilkenny | 7,358 | 57,485 | 9,581 | 12.80 | 0.77 |
| Cork South-Central | 4,862 | 56,259 | 9,377 | 8.64 | 0.52 |
| Dublin South-Central | 4,701 | 51,692 | 8,616 | 9.09 | 0.55 |
| Dublin South-East | 3,480 | 38,270 | 7,655 | 9.09 | 0.45 |
| Dublin South-West | 5,065 | 41,454 | 8,291 | 12.22 | 0.61 |
| Dun Laoghaire | 6,484 | 55,702 | 9,284 | 11.64 | 0.70 |
| Galway West | 3,878 | 52,762 | 8,794 | 7.35 | 0.44 |
| Kerry North | 6,739 | 34,764 | 8,692 | 19.38 | 0.78 |
| Kildare | 7,567 | 53,705 | 8,951 | 14.09 | 0.85 |
| Louth | 6,205 | 46,809 | 9,362 | 13.26 | 0.66 |
| Wexford | 5,086 | 52,922 | 8,821 | 9.61 | 0.58 |
| Wicklow | 7,754 | 46,003 | 9,201 | 16.86 | 0.84 |
Voting statistics for constituencies in which Labour won seats at the 1987 General Election.
The table above shows that there was no constituency in 1987 in which a Labour candidate exceeded the quota and indeed successful Labour candidates, Ruairi Quinn and Michael D. Higgins won seats in their constituencies despite winning less than half of the quota in their first preference votes. In addition, Dick Spring came within a handful of votes of losing his seat in Kerry North.)
The changing seat numbers for the parties in the different analyses points to one reason why the Irish electoral system is not entirely one hundred percent proportional – thus underpinning the rationale behind this series of constituency level analyses of polling figures – as the manner in which constituency boundaries are drawn, or redrawn, can act to gives certain parties a significant advantage in terms of translating their vote tallies into seat wins. This knowledge, of course, formed the basis for the gerrymanders that marked the partisan boundary redrawal system which existed up to the 1977 General Election, with the party/parties in government being in a position to be able to redraw election boundaries in a manner that would allow them to pick up extra seats. In simplistic terms, in the 1960s and 1970s this amounted to the main government options seeking to create constituency units with odd-numbers of seats in the regions of the state where their support levels were highest (where a 50% share of the vote would be sufficient to allow them win 2 seats in a 3-seat constituency or 3 seats in a 5-seat constituency) and constituency units with even numbers of seats (i.e. 4-seat constituencies) where their support levels were weaker as a 40% share of the vote would be sufficient to allow them win 2 seats out of 4. Since the introduction of independent boundary commissions following the 1977 General Election, partisan influences no longer can skew the boundary drawing process in favour of a government party, or government parties, but as the example here shows a significant redrawal such as that envisaged in the 2012 Constituency Commission report will probably tend to disproportionately advantage, or disadvantage, certain parties or political groupings. Similarly, as the range of constituency level analyses prior to the 2011 General Election displayed, a party’s ability to take advantage of such disproportionality in the system, whether arising from constituency boundaries or a tendency for the Irish system to favour the larger parties, is dependent on that party maintaining its support at, or above, a certain level, as a fall in support for that party, even if relatively minimal, can lead to disproportionate level of potential seat losses if party support levels fall below a certain “tipping point”.
This concept of a “tipping point” is especially notable in the case of Fianna Fail. When the party’s support level fell below 20% in the latter part of 2010, this meant that the party – especially given its traditional catch all nature of support – was now in a position where it was struggling to win seats in a number of three-seat and four-seat constituencies, as well as five-seat constituencies in the Dublin region, where Fianna Fail support was notably weaker in 2011. The boundary changes associated with the 2012 Constituency Commission report acted to ensure the party would actually gain seats, irrespective of gains in support levels, as suggested by previous posts. With party support now over 20%, and with a very fractured political environment in which significant vote levels are being won by a number of different parties and political groupings, as opposed to the more straight-forward political landscape of the early 1980s, Fianna Fail is now in a position where it can expect to win seats in most of the larger (four and five seat) constituencies and will be competitive in most three-seat constituencies, especially in rural Ireland. This is translating into a disproportionate gain, relative to support trends, in seat levels for Fianna Fail. The level of seat gains suggested for Fianna Fail in this analysis also underpins the extent of “near misses” that the party endured in a number of constituencies at the last general election, meaning only a slight increase in support in a number of constituencies would translate such “near misses” into seat gains, especially with the assistance of the recent boundary changes in a number of cases. Unlike Fianna Fail, Sinn Fein prospects of transforming vote gains into seat gains is stymied by the party’s weakness in certain constituencies, in which the party is likely to remain uncompetitive even if it should gain a few extra percentage points in terms of support levels. The more regional nature of the Sinn Fein support base is ideal for translating smaller levels of support into seat levels in its stronger areas, but it means the party may struggle to make the significant levels of seat gains on the basis of further increases in support that Fianna Fail could hope to make. Ultimately the political landscape of the next Dail will be determined by what levels of support these parties are standing on when the next election takes place (which could be as late as Spring 2016) but it will also be shaped by the different parties’ geographies of support, and the extent to which these support geographies might entitle these to a “bias” in terms of seat levels relative to support levels, or see the parties winning fewer seats that their support levels would suggest.
**************************
The constituency support estimates based on the Sunday Business Post-Red C poll figures (15th September 2013), when using the new constituency units (as used for the next general election), are as follows:
| FF | FG | LB | SF | OTH | GP | |
| Carlow-Kilkenny | 36% | 29% | 8% | 15% | 5% | 6% |
| Cavan-Monaghan | 22% | 26% | 3% | 39% | 9% | 1% |
| Clare | 29% | 31% | 7% | 6% | 23% | 4% |
| Cork East | 25% | 30% | 18% | 20% | 5% | 3% |
| Cork North Central | 20% | 20% | 13% | 24% | 19% | 3% |
| Cork North West | 34% | 38% | 8% | 13% | 5% | 3% |
| Cork South Central | 37% | 25% | 9% | 13% | 10% | 5% |
| Cork South West | 32% | 38% | 8% | 13% | 6% | 4% |
| Donegal | 22% | 16% | 3% | 40% | 17% | 2% |
| Dublin Central | 15% | 11% | 14% | 25% | 30% | 4% |
| Dublin Mid West | 16% | 24% | 17% | 20% | 15% | 8% |
| Dublin Fingal | 20% | 24% | 13% | 5% | 21% | 17% |
| Dublin Bay North | 17% | 26% | 16% | 16% | 21% | 3% |
| Dublin North West | 18% | 15% | 22% | 34% | 9% | 3% |
| Dublin Rathdown | 12% | 27% | 8% | 4% | 33% | 15% |
| Dublin South Central | 13% | 17% | 19% | 25% | 22% | 4% |
| Dublin Bay South | 15% | 28% | 14% | 7% | 21% | 14% |
| Dublin South West | 14% | 23% | 17% | 22% | 17% | 6% |
| Dublin West | 24% | 22% | 15% | 11% | 25% | 3% |
| Dun Laoghaire | 21% | 28% | 16% | 4% | 22% | 9% |
| Galway East | 24% | 34% | 8% | 9% | 25% | 2% |
| Galway West | 25% | 25% | 6% | 10% | 31% | 4% |
| Kerry County | 15% | 25% | 8% | 18% | 32% | 2% |
| Kildare North | 20% | 27% | 16% | 10% | 22% | 4% |
| Kildare South | 30% | 27% | 15% | 11% | 13% | 3% |
| Laois | 36% | 27% | 6% | 22% | 8% | 1% |
| Offaly | 29% | 19% | 2% | 10% | 39% | 1% |
| Limerick City | 31% | 34% | 12% | 14% | 6% | 2% |
| Limerick | 27% | 41% | 8% | 7% | 15% | 2% |
| Longford-Westmeath | 28% | 31% | 15% | 14% | 11% | 1% |
| Louth | 19% | 22% | 9% | 33% | 8% | 9% |
| Mayo | 23% | 51% | 3% | 12% | 10% | 1% |
| Meath East | 27% | 32% | 11% | 15% | 11% | 2% |
| Meath West | 24% | 34% | 7% | 28% | 5% | 3% |
| Roscommon-Galway | 19% | 31% | 5% | 10% | 35% | 1% |
| Sligo-Leitrim | 28% | 25% | 4% | 27% | 13% | 1% |
| Tipperary | 19% | 21% | 8% | 9% | 42% | 2% |
| Waterford | 19% | 29% | 10% | 17% | 23% | 2% |
| Wexford | 25% | 27% | 11% | 10% | 26% | 1% |
| Wicklow | 14% | 30% | 9% | 17% | 27% | 3% |
| STATE | 23% | 27% | 10% | 17% | 19% | 4% |
Based on these constituency estimates and using a d’Hondt method to determine which party wins the seats in a constituency, the party seat levels are estimated as follows:
| FF | FG | LB | SF | OTH | GP | |
| Carlow-Kilkenny | 2 | 2 | 0 | 1 | 0 | 0 |
| Cavan-Monaghan | 1 | 1 | 0 | 2 | 0 | 0 |
| Clare | 1 | 2 | 0 | 0 | 1 | 0 |
| Cork East | 1 | 1 | 1 | 1 | 0 | 0 |
| Cork North Central | 1 | 1 | 0 | 1 | 1 | 0 |
| Cork North West | 1 | 2 | 0 | 0 | 0 | 0 |
| Cork South Central | 2 | 1 | 0 | 1 | 0 | 0 |
| Cork South West | 1 | 2 | 0 | 0 | 0 | 0 |
| Donegal | 1 | 1 | 0 | 2 | 1 | 0 |
| Dublin Central | 1 | 0 | 0 | 1 | 1 | 0 |
| Dublin Mid West | 1 | 1 | 1 | 1 | 0 | 0 |
| Dublin Fingal | 1 | 1 | 1 | 0 | 1 | 1 |
| Dublin Bay North | 1 | 1 | 1 | 1 | 1 | 0 |
| Dublin North West | 1 | 0 | 1 | 1 | 0 | 0 |
| Dublin Rathdown | 0 | 1 | 0 | 0 | 2 | 0 |
| Dublin South Central | 0 | 1 | 1 | 1 | 1 | 0 |
| Dublin Bay South | 1 | 1 | 0 | 0 | 1 | 1 |
| Dublin South West | 1 | 1 | 1 | 1 | 1 | 0 |
| Dublin West | 1 | 1 | 1 | 0 | 1 | 0 |
| Dun Laoghaire | 1 | 2 | 0 | 0 | 1 | 0 |
| Galway East | 1 | 1 | 0 | 0 | 1 | 0 |
| Galway West | 2 | 1 | 0 | 0 | 2 | 0 |
| Kerry County | 1 | 1 | 0 | 1 | 2 | 0 |
| Kildare North | 1 | 1 | 1 | 0 | 1 | 0 |
| Kildare South | 1 | 1 | 1 | 0 | 0 | 0 |
| Laois | 1 | 1 | 0 | 1 | 0 | 0 |
| Offaly | 1 | 1 | 0 | 0 | 1 | 0 |
| Limerick City | 2 | 2 | 0 | 0 | 0 | 0 |
| Limerick | 1 | 2 | 0 | 0 | 0 | 0 |
| Longford-Westmeath | 1 | 2 | 1 | 0 | 0 | 0 |
| Louth | 1 | 2 | 0 | 2 | 0 | 0 |
| Mayo | 1 | 3 | 0 | 0 | 0 | 0 |
| Meath East | 1 | 2 | 0 | 0 | 0 | 0 |
| Meath West | 1 | 1 | 0 | 1 | 0 | 0 |
| Roscommon-Galway | 1 | 1 | 0 | 0 | 1 | 0 |
| Sligo-Leitrim | 2 | 1 | 0 | 1 | 0 | 0 |
| Tipperary | 1 | 1 | 0 | 0 | 3 | 0 |
| Waterford | 1 | 1 | 0 | 1 | 1 | 0 |
| Wexford | 1 | 2 | 0 | 0 | 2 | 0 |
| Wicklow | 1 | 2 | 0 | 1 | 1 | 0 |
| STATE | 43 | 52 | 11 | 22 | 28 | 2 |
These estimates also need to take account of the candidate and competition trends unique to the different constituency. Amending the model to account for seats that may be won or lost on the basis of estimates here being based on support levels derived due to a large/small number of candidates contesting the election in 2011 (as in the large number of independent candidates competing in constituencies such as Wicklow or Laois-Offaly in 2011) or one candidate polling especially well in that election (e.g. the Shane Ross vote in Dublin South/Mick Wallace vote in Wexford) in a manner that would not amount to an extra seat for another member of the same party/grouping. Vote transfer patterns and vote management issues (e.g. discrepancies between votes won by party front runners and their running mates which would see potential seat wins fall out of a party’s hands) also need to be accounted for. Taking these concerns into account, the amended seat allocations across the constituencies would look more like this
| FF | FG | LB | SF | OTH | GP | |
| Carlow-Kilkenny | 2 | 2 | 0 | 1 | 0 | 0 |
| Cavan-Monaghan | 1 | 1 | 0 | 2 | 0 | 0 |
| Clare | 1 | 2 | 0 | 0 | 1 | 0 |
| Cork East | 1 | 1 | 1 | 1 | 0 | 0 |
| Cork North Central | 1 | 1 | 0 | 1 | 1 | 0 |
| Cork North West | 1 | 2 | 0 | 0 | 0 | 0 |
| Cork South Central | 2 | 1 | 0 | 1 | 0 | 0 |
| Cork South West | 1 | 2 | 0 | 0 | 0 | 0 |
| Donegal | 1 | 1 | 0 | 2 | 1 | 0 |
| Dublin Central | 1 | 0 | 0 | 1 | 1 | 0 |
| Dublin Mid West | 1 | 1 | 1 | 1 | 0 | 0 |
| Dublin Fingal | 1 | 1 | 1 | 0 | 1 | 1 |
| Dublin Bay North | 1 | 1 | 1 | 1 | 1 | 0 |
| Dublin North West | 1 | 0 | 1 | 1 | 0 | 0 |
| Dublin Rathdown | 0 | 1 | 0 | 0 | 1 | 1 |
| Dublin South Central | 0 | 1 | 1 | 1 | 1 | 0 |
| Dublin Bay South | 1 | 1 | 0 | 0 | 1 | 1 |
| Dublin South West | 1 | 2 | 1 | 1 | 0 | 0 |
| Dublin West | 1 | 1 | 1 | 0 | 1 | 0 |
| Dun Laoghaire | 1 | 2 | 1 | 0 | 0 | 0 |
| Galway East | 1 | 1 | 0 | 0 | 1 | 0 |
| Galway West | 2 | 1 | 0 | 0 | 2 | 0 |
| Kerry County | 1 | 1 | 0 | 1 | 2 | 0 |
| Kildare North | 1 | 1 | 1 | 0 | 1 | 0 |
| Kildare South | 1 | 1 | 1 | 0 | 0 | 0 |
| Laois | 1 | 1 | 0 | 1 | 0 | 0 |
| Offaly | 1 | 1 | 0 | 0 | 1 | 0 |
| Limerick City | 2 | 2 | 0 | 0 | 0 | 0 |
| Limerick | 1 | 2 | 0 | 0 | 0 | 0 |
| Longford-Westmeath | 1 | 2 | 1 | 0 | 0 | 0 |
| Louth | 1 | 2 | 0 | 2 | 0 | 0 |
| Mayo | 1 | 3 | 0 | 0 | 0 | 0 |
| Meath East | 1 | 2 | 0 | 0 | 0 | 0 |
| Meath West | 1 | 1 | 0 | 1 | 0 | 0 |
| Roscommon-Galway | 1 | 1 | 0 | 0 | 1 | 0 |
| Sligo-Leitrim | 2 | 1 | 0 | 1 | 0 | 0 |
| Tipperary | 1 | 1 | 0 | 0 | 3 | 0 |
| Waterford | 1 | 1 | 0 | 1 | 1 | 0 |
| Wexford | 2 | 2 | 0 | 0 | 1 | 0 |
| Wicklow | 1 | 2 | 0 | 1 | 1 | 0 |
| STATE | 44 | 53 | 12 | 22 | 24 | 3 |
| % seats | 27.8 | 33.5 | 7.6 | 13.9 | 15.2 | 1.9 |
Based on these seat estimates, a Fine Gael-Labour (combined seat level of 65 seats) would fall somewhat short of the number of seats required to form a government (79), as also would a Fianna Fail-Sinn Fein (combined seat level of 66 seats). To have a sufficient number of seats required to command a majority in Dail Eireann (79 seats in a 158 seat Dail, assuming a deputy from another party/grouping takes on the Ceann Comhairle role), both alliances would need the support of twelve, or more, TDs from the Green Party and/or another political grouping to be able to form a government. A Fine Gael and Sinn Fein pairing would come very close to the 79-seat level (combined seat level of 75 seats), but such an alliance looks to be unlikely in the present political climate. Ultimately, based on these numbers a Fianna Fail-Fine Gael coalition government would be the only viable two-party coalition and such an alliance would command a very strong Dail majority (with a combined seat level of 97 seats).
This is the best poll finding for the Green Party in many years and on these figures the analysis suggests the party would win a seat in Dublin Fingal and hence regain the seat held in Dublin North by Trevor Sargent between 1992 and 2011. The analysis suggests that the party could also win seats in Dublin Bay South and Dublin Rathdown, though the cases here are not as clear cut as Dublin Fingal, and the margins involved in deciding whether the Greens won or lose in these areas would appear to be very tight based on these figures. Ultimately, the party’s prospects of winning in these constituencies (on these figures) would be reliant on their vote transfer patterns improving back towards the levels enjoyed by the party before it entered government in 2007. if transfers did not favour the party, Fine Gael would appear to be the most likely beneficiary in terms of the destination of the seats in question.
*************************************************************
The constituency support estimates based on the Sunday Times-Behaviour & Attitudes poll figures (22nd September 2013), when using the new constituency units (as used for the next general election), are as follows:
| FF | FG | LB | SF | OTH | GP | |
| Carlow-Kilkenny | 35% | 28% | 9% | 17% | 6% | 5% |
| Cavan-Monaghan | 20% | 24% | 3% | 42% | 10% | 1% |
| Clare | 26% | 29% | 8% | 6% | 28% | 3% |
| Cork East | 23% | 28% | 20% | 22% | 6% | 2% |
| Cork North Central | 18% | 18% | 14% | 25% | 23% | 2% |
| Cork North West | 32% | 36% | 9% | 14% | 6% | 2% |
| Cork South Central | 35% | 24% | 11% | 15% | 12% | 4% |
| Cork South West | 31% | 36% | 9% | 14% | 7% | 3% |
| Donegal | 20% | 14% | 4% | 41% | 20% | 1% |
| Dublin Central | 13% | 10% | 15% | 25% | 34% | 3% |
| Dublin Mid West | 15% | 22% | 18% | 21% | 18% | 6% |
| Dublin Fingal | 19% | 22% | 15% | 5% | 26% | 13% |
| Dublin Bay North | 15% | 24% | 17% | 17% | 25% | 3% |
| Dublin North West | 16% | 13% | 24% | 35% | 11% | 2% |
| Dublin Rathdown | 11% | 24% | 9% | 5% | 40% | 11% |
| Dublin South Central | 11% | 15% | 20% | 25% | 26% | 3% |
| Dublin Bay South | 14% | 26% | 16% | 7% | 26% | 11% |
| Dublin South West | 13% | 21% | 19% | 23% | 20% | 4% |
| Dublin West | 21% | 19% | 16% | 11% | 30% | 2% |
| Dun Laoghaire | 19% | 26% | 17% | 4% | 27% | 7% |
| Galway East | 22% | 31% | 8% | 9% | 29% | 1% |
| Galway West | 22% | 22% | 6% | 10% | 37% | 3% |
| Kerry County | 13% | 22% | 9% | 18% | 37% | 1% |
| Kildare North | 18% | 25% | 18% | 10% | 26% | 3% |
| Kildare South | 28% | 25% | 17% | 12% | 16% | 3% |
| Laois | 33% | 25% | 7% | 24% | 10% | 1% |
| Offaly | 26% | 17% | 2% | 10% | 45% | 1% |
| Limerick City | 29% | 33% | 13% | 15% | 8% | 2% |
| Limerick | 25% | 39% | 9% | 7% | 19% | 1% |
| Longford-Westmeath | 26% | 29% | 17% | 15% | 13% | 1% |
| Louth | 17% | 20% | 10% | 35% | 10% | 7% |
| Mayo | 22% | 48% | 3% | 13% | 13% | 1% |
| Meath East | 25% | 30% | 13% | 17% | 14% | 2% |
| Meath West | 22% | 32% | 8% | 31% | 6% | 2% |
| Roscommon-Galway | 16% | 27% | 6% | 10% | 41% | 1% |
| Sligo-Leitrim | 26% | 23% | 4% | 29% | 16% | 1% |
| Tipperary | 16% | 18% | 8% | 9% | 48% | 1% |
| Waterford | 17% | 26% | 11% | 17% | 27% | 1% |
| Wexford | 23% | 24% | 12% | 10% | 31% | 1% |
| Wicklow | 13% | 27% | 10% | 17% | 31% | 2% |
Based on these constituency estimates and using a d’Hondt method to determine which party wins the seats in a constituency, the party seat levels are estimated as follows:
| FF | FG | LB | SF | OTH | GP | |
| Carlow-Kilkenny | 2 | 2 | 0 | 1 | 0 | 0 |
| Cavan-Monaghan | 1 | 1 | 0 | 2 | 0 | 0 |
| Clare | 1 | 2 | 0 | 0 | 1 | 0 |
| Cork East | 1 | 1 | 1 | 1 | 0 | 0 |
| Cork North Central | 1 | 1 | 0 | 1 | 1 | 0 |
| Cork North West | 1 | 2 | 0 | 0 | 0 | 0 |
| Cork South Central | 2 | 1 | 0 | 1 | 0 | 0 |
| Cork South West | 1 | 2 | 0 | 0 | 0 | 0 |
| Donegal | 1 | 1 | 0 | 2 | 1 | 0 |
| Dublin Central | 0 | 0 | 0 | 1 | 2 | 0 |
| Dublin Mid West | 0 | 1 | 1 | 1 | 1 | 0 |
| Dublin Fingal | 1 | 1 | 1 | 0 | 2 | 0 |
| Dublin Bay North | 1 | 1 | 1 | 1 | 1 | 0 |
| Dublin North West | 0 | 0 | 1 | 2 | 0 | 0 |
| Dublin Rathdown | 0 | 1 | 0 | 0 | 2 | 0 |
| Dublin South Central | 0 | 1 | 1 | 1 | 1 | 0 |
| Dublin Bay South | 1 | 1 | 1 | 0 | 1 | 0 |
| Dublin South West | 1 | 1 | 1 | 1 | 1 | 0 |
| Dublin West | 1 | 1 | 1 | 0 | 1 | 0 |
| Dun Laoghaire | 1 | 2 | 0 | 0 | 1 | 0 |
| Galway East | 1 | 1 | 0 | 0 | 1 | 0 |
| Galway West | 2 | 1 | 0 | 0 | 2 | 0 |
| Kerry County | 1 | 1 | 0 | 1 | 2 | 0 |
| Kildare North | 1 | 1 | 1 | 0 | 1 | 0 |
| Kildare South | 1 | 1 | 1 | 0 | 0 | 0 |
| Laois | 1 | 1 | 0 | 1 | 0 | 0 |
| Offaly | 1 | 0 | 0 | 0 | 2 | 0 |
| Limerick City | 1 | 2 | 0 | 1 | 0 | 0 |
| Limerick | 1 | 2 | 0 | 0 | 0 | 0 |
| Longford-Westmeath | 1 | 2 | 1 | 0 | 0 | 0 |
| Louth | 1 | 1 | 0 | 2 | 1 | 0 |
| Mayo | 1 | 3 | 0 | 0 | 0 | 0 |
| Meath East | 1 | 1 | 0 | 1 | 0 | 0 |
| Meath West | 1 | 1 | 0 | 1 | 0 | 0 |
| Roscommon-Galway | 0 | 1 | 0 | 0 | 2 | 0 |
| Sligo-Leitrim | 1 | 1 | 0 | 2 | 0 | 0 |
| Tipperary | 1 | 1 | 0 | 0 | 3 | 0 |
| Waterford | 1 | 1 | 0 | 1 | 1 | 0 |
| Wexford | 1 | 2 | 0 | 0 | 2 | 0 |
| Wicklow | 0 | 2 | 0 | 1 | 2 | 0 |
| STATE | 36 | 49 | 12 | 26 | 35 | 0 |
These estimates also need to take account of the candidate and competition trends unique to the different constituency. Amending the model to account for seats that may be won or lost on the basis of estimates here being based on support levels derived due to a large/small number of candidates contesting the election in 2011 (as in the large number of independent candidates competing in constituencies such as Wicklow or Laois-Offaly in 2011) or one candidate polling especially well in that election (e.g. the Shane Ross vote in Dublin South/Mick Wallace vote in Wexford) in a manner that would not amount to an extra seat for another member of the same party/grouping. Vote transfer patterns and vote management issues (e.g. discrepancies between votes won by party front runners and their running mates which would see potential seat wins fall out of a party’s hands) also need to be accounted for. Taking these concerns into account, the amended seat allocations across the constituencies would look more like this:
| FF | FG | LB | SF | OTH | GP | |
| Carlow-Kilkenny | 2 | 2 | 0 | 1 | 0 | 0 |
| Cavan-Monaghan | 1 | 1 | 0 | 2 | 0 | 0 |
| Clare | 1 | 2 | 0 | 0 | 1 | 0 |
| Cork East | 1 | 1 | 1 | 1 | 0 | 0 |
| Cork North Central | 1 | 1 | 0 | 1 | 1 | 0 |
| Cork North West | 1 | 2 | 0 | 0 | 0 | 0 |
| Cork South Central | 2 | 1 | 0 | 1 | 0 | 0 |
| Cork South West | 1 | 2 | 0 | 0 | 0 | 0 |
| Donegal | 1 | 1 | 0 | 2 | 1 | 0 |
| Dublin Central | 0 | 0 | 0 | 1 | 2 | 0 |
| Dublin Mid West | 1 | 1 | 1 | 1 | 0 | 0 |
| Dublin Fingal | 1 | 1 | 1 | 0 | 1 | 1 |
| Dublin Bay North | 1 | 1 | 1 | 1 | 1 | 0 |
| Dublin North West | 0 | 0 | 1 | 2 | 0 | 0 |
| Dublin Rathdown | 0 | 1 | 0 | 0 | 2 | 0 |
| Dublin South Central | 0 | 1 | 1 | 1 | 1 | 0 |
| Dublin Bay South | 1 | 1 | 1 | 0 | 1 | 0 |
| Dublin South West | 1 | 1 | 1 | 1 | 1 | 0 |
| Dublin West | 1 | 1 | 1 | 0 | 1 | 0 |
| Dun Laoghaire | 1 | 2 | 0 | 0 | 1 | 0 |
| Galway East | 1 | 1 | 0 | 0 | 1 | 0 |
| Galway West | 2 | 1 | 0 | 0 | 2 | 0 |
| Kerry County | 1 | 1 | 0 | 1 | 2 | 0 |
| Kildare North | 1 | 1 | 1 | 0 | 1 | 0 |
| Kildare South | 1 | 1 | 1 | 0 | 0 | 0 |
| Laois | 1 | 1 | 0 | 1 | 0 | 0 |
| Offaly | 1 | 1 | 0 | 0 | 1 | 0 |
| Limerick City | 1 | 2 | 0 | 1 | 0 | 0 |
| Limerick | 1 | 2 | 0 | 0 | 0 | 0 |
| Longford-Westmeath | 1 | 2 | 1 | 0 | 0 | 0 |
| Louth | 1 | 2 | 0 | 2 | 0 | 0 |
| Mayo | 1 | 3 | 0 | 0 | 0 | 0 |
| Meath East | 1 | 1 | 0 | 1 | 0 | 0 |
| Meath West | 1 | 1 | 0 | 1 | 0 | 0 |
| Roscommon-Galway | 1 | 1 | 0 | 0 | 1 | 0 |
| Sligo-Leitrim | 1 | 1 | 0 | 2 | 0 | 0 |
| Tipperary | 1 | 1 | 0 | 0 | 3 | 0 |
| Waterford | 1 | 1 | 0 | 1 | 1 | 0 |
| Wexford | 1 | 2 | 1 | 0 | 1 | 0 |
| Wicklow | 1 | 2 | 0 | 1 | 1 | 0 |
| STATE | 39 | 51 | 13 | 26 | 28 | 1 |
| % seats | 24.7 | 32.3 | 8.2 | 16.5 | 17.7 | 0.6 |
Based on these seat estimates, a Fine Gael-Labour (combined seat level of 64 seats) would fall somewhat short of the number of seats required to form a government (79), as also would a Fianna Fail-Sinn Fein (combined seat level of 65 seats). To have a sufficient number of seats required to command a majority in Dail Eireann (79 seats in a 158 seat Dail, assuming a deputy from another party/grouping takes on the Ceann Comhairle role), both alliances would need the support of twelve, or more, TDs from the Green Party and/or another political grouping to be able to form a government. A Fine Gael and Sinn Fein pairing (77 seats) would come very close to the 79-seat level (combined seat level of 75 seats), but such an alliance looks to be unlikely in the present political climate. Ultimately, based on these numbers a Fianna Fail-Fine Gael coalition government would be the only viable two-party coalition and such an alliance would command a very strong Dail majority (with a combined seat level of 90 seats).
*************************************************************
The constituency support estimates based on the Sunday Independent-Millward Brown poll figures (29th September 2013), when using the new constituency units (as used for the next general election), are as follows:
| FF | FG | LB | SF | OTH | GP | |
| Carlow-Kilkenny | 41% | 29% | 8% | 17% | 4% | 1% |
| Cavan-Monaghan | 25% | 25% | 2% | 41% | 6% | 0% |
| Clare | 34% | 33% | 8% | 7% | 17% | 1% |
| Cork East | 28% | 30% | 17% | 22% | 3% | 1% |
| Cork North Central | 24% | 21% | 13% | 27% | 14% | 1% |
| Cork North West | 38% | 37% | 7% | 14% | 3% | 1% |
| Cork South Central | 42% | 25% | 9% | 15% | 7% | 1% |
| Cork South West | 36% | 38% | 7% | 13% | 4% | 1% |
| Donegal | 25% | 16% | 3% | 43% | 12% | 0% |
| Dublin Central | 19% | 12% | 15% | 29% | 23% | 1% |
| Dublin Mid West | 20% | 26% | 17% | 24% | 11% | 2% |
| Dublin Fingal | 27% | 28% | 15% | 6% | 18% | 5% |
| Dublin Bay North | 20% | 28% | 16% | 19% | 16% | 1% |
| Dublin North West | 20% | 15% | 21% | 36% | 6% | 1% |
| Dublin Rathdown | 17% | 33% | 10% | 6% | 29% | 5% |
| Dublin South Central | 16% | 18% | 20% | 29% | 17% | 1% |
| Dublin Bay South | 20% | 33% | 16% | 8% | 18% | 4% |
| Dublin South West | 17% | 25% | 18% | 25% | 13% | 2% |
| Dublin West | 29% | 23% | 16% | 13% | 19% | 1% |
| Dun Laoghaire | 26% | 32% | 17% | 5% | 18% | 3% |
| Galway East | 29% | 35% | 8% | 10% | 18% | 0% |
| Galway West | 31% | 27% | 6% | 11% | 24% | 1% |
| Kerry County | 19% | 27% | 8% | 21% | 24% | 0% |
| Kildare North | 25% | 29% | 17% | 12% | 16% | 1% |
| Kildare South | 35% | 28% | 15% | 12% | 10% | 1% |
| Laois | 39% | 26% | 6% | 23% | 5% | 0% |
| Offaly | 36% | 21% | 2% | 11% | 30% | 0% |
| Limerick City | 35% | 34% | 11% | 15% | 5% | 1% |
| Limerick | 31% | 42% | 8% | 7% | 11% | 0% |
| Longford-Westmeath | 32% | 31% | 15% | 15% | 7% | 0% |
| Louth | 22% | 23% | 9% | 37% | 6% | 2% |
| Mayo | 26% | 51% | 3% | 13% | 7% | 0% |
| Meath East | 31% | 32% | 11% | 17% | 8% | 1% |
| Meath West | 26% | 33% | 7% | 30% | 3% | 1% |
| Roscommon-Galway | 23% | 33% | 5% | 11% | 27% | 0% |
| Sligo-Leitrim | 32% | 25% | 4% | 29% | 9% | 0% |
| Tipperary | 24% | 23% | 8% | 11% | 33% | 0% |
| Waterford | 23% | 31% | 10% | 19% | 17% | 0% |
| Wexford | 30% | 28% | 11% | 11% | 19% | 0% |
| Wicklow | 17% | 32% | 9% | 20% | 21% | 1% |
Based on these constituency estimates and using a d’Hondt method to determine which party wins the seats in a constituency, the party seat levels are estimated as follows:
| FF | FG | LB | SF | OTH | GP | |
| Carlow-Kilkenny | 2 | 2 | 0 | 1 | 0 | 0 |
| Cavan-Monaghan | 1 | 1 | 0 | 2 | 0 | 0 |
| Clare | 2 | 1 | 0 | 0 | 1 | 0 |
| Cork East | 1 | 1 | 1 | 1 | 0 | 0 |
| Cork North Central | 1 | 1 | 0 | 1 | 1 | 0 |
| Cork North West | 2 | 1 | 0 | 0 | 0 | 0 |
| Cork South Central | 2 | 1 | 0 | 1 | 0 | 0 |
| Cork South West | 1 | 2 | 0 | 0 | 0 | 0 |
| Donegal | 1 | 1 | 0 | 3 | 0 | 0 |
| Dublin Central | 1 | 0 | 0 | 1 | 1 | 0 |
| Dublin Mid West | 1 | 1 | 1 | 1 | 0 | 0 |
| Dublin Fingal | 1 | 2 | 1 | 0 | 1 | 0 |
| Dublin Bay North | 1 | 1 | 1 | 1 | 1 | 0 |
| Dublin North West | 1 | 0 | 1 | 1 | 0 | 0 |
| Dublin Rathdown | 1 | 1 | 0 | 0 | 1 | 0 |
| Dublin South Central | 0 | 1 | 1 | 1 | 1 | 0 |
| Dublin Bay South | 1 | 2 | 0 | 0 | 1 | 0 |
| Dublin South West | 1 | 1 | 1 | 1 | 1 | 0 |
| Dublin West | 1 | 1 | 1 | 0 | 1 | 0 |
| Dun Laoghaire | 1 | 2 | 0 | 0 | 1 | 0 |
| Galway East | 1 | 1 | 0 | 0 | 1 | 0 |
| Galway West | 2 | 2 | 0 | 0 | 1 | 0 |
| Kerry County | 1 | 2 | 0 | 1 | 1 | 0 |
| Kildare North | 1 | 1 | 1 | 0 | 1 | 0 |
| Kildare South | 2 | 1 | 0 | 0 | 0 | 0 |
| Laois | 1 | 1 | 0 | 1 | 0 | 0 |
| Offaly | 1 | 1 | 0 | 0 | 1 | 0 |
| Limerick City | 2 | 2 | 0 | 0 | 0 | 0 |
| Limerick | 1 | 2 | 0 | 0 | 0 | 0 |
| Longford-Westmeath | 2 | 2 | 0 | 0 | 0 | 0 |
| Louth | 1 | 1 | 0 | 3 | 0 | 0 |
| Mayo | 1 | 3 | 0 | 0 | 0 | 0 |
| Meath East | 1 | 1 | 0 | 1 | 0 | 0 |
| Meath West | 1 | 1 | 0 | 1 | 0 | 0 |
| Roscommon-Galway | 1 | 1 | 0 | 0 | 1 | 0 |
| Sligo-Leitrim | 2 | 1 | 0 | 1 | 0 | 0 |
| Tipperary | 2 | 1 | 0 | 0 | 2 | 0 |
| Waterford | 1 | 1 | 0 | 1 | 1 | 0 |
| Wexford | 2 | 2 | 0 | 0 | 1 | 0 |
| Wicklow | 1 | 2 | 0 | 1 | 1 | 0 |
| STATE | 50 | 52 | 9 | 25 | 22 | 0 |
These estimates also need to take account of the candidate and competition trends unique to the different constituency. Amending the model to account for seats that may be won or lost on the basis of estimates here being based on support levels derived due to a large/small number of candidates contesting the election in 2011 (as in the large number of independent candidates competing in constituencies such as Wicklow or Laois-Offaly in 2011) or one candidate polling especially well in that election (e.g. the Shane Ross vote in Dublin South/Mick Wallace vote in Wexford) in a manner that would not amount to an extra seat for another member of the same party/grouping. Vote transfer patterns and vote management issues (e.g. discrepancies between votes won by party front runners and their running mates which would see potential seat wins fall out of a party’s hands) also need to be accounted for. Taking these concerns into account, the amended seat allocations across the constituencies would look more like this:
| FF | FG | LB | SF | OTH | GP | |
| Carlow-Kilkenny | 2 | 2 | 0 | 1 | 0 | 0 |
| Cavan-Monaghan | 1 | 1 | 0 | 2 | 0 | 0 |
| Clare | 2 | 1 | 0 | 0 | 1 | 0 |
| Cork East | 1 | 1 | 1 | 1 | 0 | 0 |
| Cork North Central | 1 | 1 | 0 | 2 | 0 | 0 |
| Cork North West | 2 | 1 | 0 | 0 | 0 | 0 |
| Cork South Central | 2 | 1 | 0 | 1 | 0 | 0 |
| Cork South West | 1 | 2 | 0 | 0 | 0 | 0 |
| Donegal | 1 | 1 | 0 | 3 | 0 | 0 |
| Dublin Central | 1 | 0 | 0 | 1 | 1 | 0 |
| Dublin Mid West | 1 | 1 | 1 | 1 | 0 | 0 |
| Dublin Fingal | 1 | 2 | 1 | 0 | 1 | 0 |
| Dublin Bay North | 1 | 1 | 1 | 1 | 1 | 0 |
| Dublin North West | 1 | 0 | 1 | 1 | 0 | 0 |
| Dublin Rathdown | 1 | 1 | 0 | 0 | 1 | 0 |
| Dublin South Central | 1 | 1 | 1 | 1 | 0 | 0 |
| Dublin Bay South | 1 | 2 | 1 | 0 | 0 | 0 |
| Dublin South West | 1 | 1 | 1 | 2 | 0 | 0 |
| Dublin West | 1 | 1 | 1 | 0 | 1 | 0 |
| Dun Laoghaire | 1 | 2 | 1 | 0 | 0 | 0 |
| Galway East | 1 | 1 | 0 | 0 | 1 | 0 |
| Galway West | 2 | 2 | 0 | 0 | 1 | 0 |
| Kerry County | 1 | 2 | 0 | 1 | 1 | 0 |
| Kildare North | 1 | 1 | 1 | 0 | 1 | 0 |
| Kildare South | 2 | 1 | 0 | 0 | 0 | 0 |
| Laois | 1 | 1 | 0 | 1 | 0 | 0 |
| Offaly | 1 | 1 | 0 | 0 | 1 | 0 |
| Limerick City | 2 | 2 | 0 | 0 | 0 | 0 |
| Limerick | 1 | 2 | 0 | 0 | 0 | 0 |
| Longford-Westmeath | 2 | 2 | 0 | 0 | 0 | 0 |
| Louth | 1 | 2 | 0 | 2 | 0 | 0 |
| Mayo | 1 | 3 | 0 | 0 | 0 | 0 |
| Meath East | 1 | 1 | 0 | 1 | 0 | 0 |
| Meath West | 1 | 1 | 0 | 1 | 0 | 0 |
| Roscommon-Galway | 1 | 1 | 0 | 0 | 1 | 0 |
| Sligo-Leitrim | 2 | 1 | 0 | 1 | 0 | 0 |
| Tipperary | 2 | 1 | 0 | 0 | 2 | 0 |
| Waterford | 1 | 1 | 0 | 1 | 1 | 0 |
| Wexford | 2 | 2 | 0 | 0 | 1 | 0 |
| Wicklow | 1 | 2 | 0 | 1 | 1 | 0 |
| STATE | 51 | 53 | 11 | 26 | 17 | 0 |
| % seats | 32.3 | 33.5 | 7.0 | 16.5 | 10.8 | 0.0 |
Based on these seat estimates, a Fine Gael-Labour (combined seat level of 64 seats) would fall somewhat short of the number of seats required to form a government (79 seats), but a Fianna Fail-Sinn Fein (combined seat level of 77 seats) would fall very close to this level. To have a sufficient number of seats required to command a majority in Dail Eireann (79 seats in a 158 seat Dail, assuming a deputy from another party/grouping takes on the Ceann Comhairle role), a Fianna Fail-Sinn Fein alliance would only need the support of two, or more, TDs from the Independent ranks or from political grouping to be able to form a government. A Fine Gael and Sinn Fein pairing (79 seats) would be able to command a bare majority in Dail Eireann, but such an alliance looks to be unlikely in the present political climate. A Fianna Fail-Fine Gael coalition government would be another viable two-party coalition and such an alliance would command a very strong Dail majority (with a combined seat level of 104 seats).
*************************************************************
The constituency support estimates based on the Sunday Independent-Millward Brown poll figures (13th October 2013), when using the new constituency units (as used for the next general election), are as follows:
| FF | FG | LB | SF | OTH | GP | |||||||||||||||||||||||||||||||||||||||||||||||||||||||||||||||||||||||||||||||||||||||||||||||||||||||||||||||||||||||||||||||||||||||||||||||||||||||||||||||||||||||||||||||||||||||||||||||||||||||||||||||||||||||||||||||||||||||||||||||||||||||||||||||||||||||||||||||||||||||||||||||||||||||
| Carlow-Kilkenny | 42% | 28% | 7% | 17% | 4% | 1% | ||||||||||||||||||||||||||||||||||||||||||||||||||||||||||||||||||||||||||||||||||||||||||||||||||||||||||||||||||||||||||||||||||||||||||||||||||||||||||||||||||||||||||||||||||||||||||||||||||||||||||||||||||||||||||||||||||||||||||||||||||||||||||||||||||||||||||||||||||||||||||||||||||||||
| Cavan-Monaghan | 25% | 24% | 2% | 41% | 7% | 0% | ||||||||||||||||||||||||||||||||||||||||||||||||||||||||||||||||||||||||||||||||||||||||||||||||||||||||||||||||||||||||||||||||||||||||||||||||||||||||||||||||||||||||||||||||||||||||||||||||||||||||||||||||||||||||||||||||||||||||||||||||||||||||||||||||||||||||||||||||||||||||||||||||||||||
| Clare | 34% | 31% | 7% | 6% | 21% | 1% | ||||||||||||||||||||||||||||||||||||||||||||||||||||||||||||||||||||||||||||||||||||||||||||||||||||||||||||||||||||||||||||||||||||||||||||||||||||||||||||||||||||||||||||||||||||||||||||||||||||||||||||||||||||||||||||||||||||||||||||||||||||||||||||||||||||||||||||||||||||||||||||||||||||||
| Cork East | 28% | 30% | 15% | 22% | 4% | 1% | ||||||||||||||||||||||||||||||||||||||||||||||||||||||||||||||||||||||||||||||||||||||||||||||||||||||||||||||||||||||||||||||||||||||||||||||||||||||||||||||||||||||||||||||||||||||||||||||||||||||||||||||||||||||||||||||||||||||||||||||||||||||||||||||||||||||||||||||||||||||||||||||||||||||
| Cork North Central | 24% | 20% | 12% | 27% | 17% | 1% | ||||||||||||||||||||||||||||||||||||||||||||||||||||||||||||||||||||||||||||||||||||||||||||||||||||||||||||||||||||||||||||||||||||||||||||||||||||||||||||||||||||||||||||||||||||||||||||||||||||||||||||||||||||||||||||||||||||||||||||||||||||||||||||||||||||||||||||||||||||||||||||||||||||||
| Cork North West | 39% | 36% | 7% | 14% | 4% | 1% | ||||||||||||||||||||||||||||||||||||||||||||||||||||||||||||||||||||||||||||||||||||||||||||||||||||||||||||||||||||||||||||||||||||||||||||||||||||||||||||||||||||||||||||||||||||||||||||||||||||||||||||||||||||||||||||||||||||||||||||||||||||||||||||||||||||||||||||||||||||||||||||||||||||||
| Cork South Central | 42% | 24% | 8% | 15% | 9% | 1% | ||||||||||||||||||||||||||||||||||||||||||||||||||||||||||||||||||||||||||||||||||||||||||||||||||||||||||||||||||||||||||||||||||||||||||||||||||||||||||||||||||||||||||||||||||||||||||||||||||||||||||||||||||||||||||||||||||||||||||||||||||||||||||||||||||||||||||||||||||||||||||||||||||||||
| Cork South West | 37% | 37% | 7% | 14% | 5% | 1% | ||||||||||||||||||||||||||||||||||||||||||||||||||||||||||||||||||||||||||||||||||||||||||||||||||||||||||||||||||||||||||||||||||||||||||||||||||||||||||||||||||||||||||||||||||||||||||||||||||||||||||||||||||||||||||||||||||||||||||||||||||||||||||||||||||||||||||||||||||||||||||||||||||||||
| Donegal | 25% | 15% | 3% | 42% | 15% | 0% | ||||||||||||||||||||||||||||||||||||||||||||||||||||||||||||||||||||||||||||||||||||||||||||||||||||||||||||||||||||||||||||||||||||||||||||||||||||||||||||||||||||||||||||||||||||||||||||||||||||||||||||||||||||||||||||||||||||||||||||||||||||||||||||||||||||||||||||||||||||||||||||||||||||||
| Dublin Central | 18% | 11% | 13% | 28% | 28% | 1% | ||||||||||||||||||||||||||||||||||||||||||||||||||||||||||||||||||||||||||||||||||||||||||||||||||||||||||||||||||||||||||||||||||||||||||||||||||||||||||||||||||||||||||||||||||||||||||||||||||||||||||||||||||||||||||||||||||||||||||||||||||||||||||||||||||||||||||||||||||||||||||||||||||||||
| Dublin Mid West | 20% | 25% | 16% | 24% | 14% | 2% | ||||||||||||||||||||||||||||||||||||||||||||||||||||||||||||||||||||||||||||||||||||||||||||||||||||||||||||||||||||||||||||||||||||||||||||||||||||||||||||||||||||||||||||||||||||||||||||||||||||||||||||||||||||||||||||||||||||||||||||||||||||||||||||||||||||||||||||||||||||||||||||||||||||||
| Dublin Fingal | 27% | 27% | 13% | 6% | 22% | 5% | ||||||||||||||||||||||||||||||||||||||||||||||||||||||||||||||||||||||||||||||||||||||||||||||||||||||||||||||||||||||||||||||||||||||||||||||||||||||||||||||||||||||||||||||||||||||||||||||||||||||||||||||||||||||||||||||||||||||||||||||||||||||||||||||||||||||||||||||||||||||||||||||||||||||
| Dublin Bay North | 20% | 27% | 15% | 19% | 19% | 1% | ||||||||||||||||||||||||||||||||||||||||||||||||||||||||||||||||||||||||||||||||||||||||||||||||||||||||||||||||||||||||||||||||||||||||||||||||||||||||||||||||||||||||||||||||||||||||||||||||||||||||||||||||||||||||||||||||||||||||||||||||||||||||||||||||||||||||||||||||||||||||||||||||||||||
| Dublin North West | 21% | 14% | 20% | 37% | 8% | 1% | ||||||||||||||||||||||||||||||||||||||||||||||||||||||||||||||||||||||||||||||||||||||||||||||||||||||||||||||||||||||||||||||||||||||||||||||||||||||||||||||||||||||||||||||||||||||||||||||||||||||||||||||||||||||||||||||||||||||||||||||||||||||||||||||||||||||||||||||||||||||||||||||||||||||
| Dublin Rathdown | 16% | 31% | 9% | 6% | 34% | 4% | ||||||||||||||||||||||||||||||||||||||||||||||||||||||||||||||||||||||||||||||||||||||||||||||||||||||||||||||||||||||||||||||||||||||||||||||||||||||||||||||||||||||||||||||||||||||||||||||||||||||||||||||||||||||||||||||||||||||||||||||||||||||||||||||||||||||||||||||||||||||||||||||||||||||
| Dublin South Central | 15% | 17% | 18% | 28% | 20% | 1% | ||||||||||||||||||||||||||||||||||||||||||||||||||||||||||||||||||||||||||||||||||||||||||||||||||||||||||||||||||||||||||||||||||||||||||||||||||||||||||||||||||||||||||||||||||||||||||||||||||||||||||||||||||||||||||||||||||||||||||||||||||||||||||||||||||||||||||||||||||||||||||||||||||||||
| Dublin Bay South | 20% | 32% | 14% | 8% | 21% | 4% | ||||||||||||||||||||||||||||||||||||||||||||||||||||||||||||||||||||||||||||||||||||||||||||||||||||||||||||||||||||||||||||||||||||||||||||||||||||||||||||||||||||||||||||||||||||||||||||||||||||||||||||||||||||||||||||||||||||||||||||||||||||||||||||||||||||||||||||||||||||||||||||||||||||||
| Dublin South West | 17% | 24% | 16% | 25% | 16% | 2% | ||||||||||||||||||||||||||||||||||||||||||||||||||||||||||||||||||||||||||||||||||||||||||||||||||||||||||||||||||||||||||||||||||||||||||||||||||||||||||||||||||||||||||||||||||||||||||||||||||||||||||||||||||||||||||||||||||||||||||||||||||||||||||||||||||||||||||||||||||||||||||||||||||||||
| Dublin West | 29% | 22% | 14% | 12% | 23% | 1% | ||||||||||||||||||||||||||||||||||||||||||||||||||||||||||||||||||||||||||||||||||||||||||||||||||||||||||||||||||||||||||||||||||||||||||||||||||||||||||||||||||||||||||||||||||||||||||||||||||||||||||||||||||||||||||||||||||||||||||||||||||||||||||||||||||||||||||||||||||||||||||||||||||||||
| Dun Laoghaire | 26% | 30% | 15% | 5% | 21% | 2% | ||||||||||||||||||||||||||||||||||||||||||||||||||||||||||||||||||||||||||||||||||||||||||||||||||||||||||||||||||||||||||||||||||||||||||||||||||||||||||||||||||||||||||||||||||||||||||||||||||||||||||||||||||||||||||||||||||||||||||||||||||||||||||||||||||||||||||||||||||||||||||||||||||||||
| Galway East | 28% | 33% | 7% | 10% | 22% | 0% | ||||||||||||||||||||||||||||||||||||||||||||||||||||||||||||||||||||||||||||||||||||||||||||||||||||||||||||||||||||||||||||||||||||||||||||||||||||||||||||||||||||||||||||||||||||||||||||||||||||||||||||||||||||||||||||||||||||||||||||||||||||||||||||||||||||||||||||||||||||||||||||||||||||||
| Galway West | 30% | 25% | 5% | 11% | 28% | 1% | ||||||||||||||||||||||||||||||||||||||||||||||||||||||||||||||||||||||||||||||||||||||||||||||||||||||||||||||||||||||||||||||||||||||||||||||||||||||||||||||||||||||||||||||||||||||||||||||||||||||||||||||||||||||||||||||||||||||||||||||||||||||||||||||||||||||||||||||||||||||||||||||||||||||
| Kerry County | 18% | 25% | 7% | 21% | 29% | 0% | ||||||||||||||||||||||||||||||||||||||||||||||||||||||||||||||||||||||||||||||||||||||||||||||||||||||||||||||||||||||||||||||||||||||||||||||||||||||||||||||||||||||||||||||||||||||||||||||||||||||||||||||||||||||||||||||||||||||||||||||||||||||||||||||||||||||||||||||||||||||||||||||||||||||
| Kildare North | 25% | 28% | 15% | 12% | 20% | 1% | ||||||||||||||||||||||||||||||||||||||||||||||||||||||||||||||||||||||||||||||||||||||||||||||||||||||||||||||||||||||||||||||||||||||||||||||||||||||||||||||||||||||||||||||||||||||||||||||||||||||||||||||||||||||||||||||||||||||||||||||||||||||||||||||||||||||||||||||||||||||||||||||||||||||
| Kildare South | 35% | 27% | 13% | 12% | 12% | 1% | ||||||||||||||||||||||||||||||||||||||||||||||||||||||||||||||||||||||||||||||||||||||||||||||||||||||||||||||||||||||||||||||||||||||||||||||||||||||||||||||||||||||||||||||||||||||||||||||||||||||||||||||||||||||||||||||||||||||||||||||||||||||||||||||||||||||||||||||||||||||||||||||||||||||
| Laois | 39% | 25% | 5% | 23% | 7% | 0% | ||||||||||||||||||||||||||||||||||||||||||||||||||||||||||||||||||||||||||||||||||||||||||||||||||||||||||||||||||||||||||||||||||||||||||||||||||||||||||||||||||||||||||||||||||||||||||||||||||||||||||||||||||||||||||||||||||||||||||||||||||||||||||||||||||||||||||||||||||||||||||||||||||||||
| Offaly | 34% | 19% | 2% | 11% | 34% | 0% | ||||||||||||||||||||||||||||||||||||||||||||||||||||||||||||||||||||||||||||||||||||||||||||||||||||||||||||||||||||||||||||||||||||||||||||||||||||||||||||||||||||||||||||||||||||||||||||||||||||||||||||||||||||||||||||||||||||||||||||||||||||||||||||||||||||||||||||||||||||||||||||||||||||||
| Limerick City | 35% | 33% | 10% | 15% | 6% | 1% | ||||||||||||||||||||||||||||||||||||||||||||||||||||||||||||||||||||||||||||||||||||||||||||||||||||||||||||||||||||||||||||||||||||||||||||||||||||||||||||||||||||||||||||||||||||||||||||||||||||||||||||||||||||||||||||||||||||||||||||||||||||||||||||||||||||||||||||||||||||||||||||||||||||||
| Limerick | 31% | 40% | 7% | 7% | 13% | 0% | ||||||||||||||||||||||||||||||||||||||||||||||||||||||||||||||||||||||||||||||||||||||||||||||||||||||||||||||||||||||||||||||||||||||||||||||||||||||||||||||||||||||||||||||||||||||||||||||||||||||||||||||||||||||||||||||||||||||||||||||||||||||||||||||||||||||||||||||||||||||||||||||||||||||
| Longford-Westmeath | 32% | 30% | 13% | 15% | 9% | 0% | ||||||||||||||||||||||||||||||||||||||||||||||||||||||||||||||||||||||||||||||||||||||||||||||||||||||||||||||||||||||||||||||||||||||||||||||||||||||||||||||||||||||||||||||||||||||||||||||||||||||||||||||||||||||||||||||||||||||||||||||||||||||||||||||||||||||||||||||||||||||||||||||||||||||
| Louth | 23% | 22% | 8% | 37% | 8% | 2% | ||||||||||||||||||||||||||||||||||||||||||||||||||||||||||||||||||||||||||||||||||||||||||||||||||||||||||||||||||||||||||||||||||||||||||||||||||||||||||||||||||||||||||||||||||||||||||||||||||||||||||||||||||||||||||||||||||||||||||||||||||||||||||||||||||||||||||||||||||||||||||||||||||||||
| Mayo | 27% | 49% | 2% | 13% | 9% | 0% | ||||||||||||||||||||||||||||||||||||||||||||||||||||||||||||||||||||||||||||||||||||||||||||||||||||||||||||||||||||||||||||||||||||||||||||||||||||||||||||||||||||||||||||||||||||||||||||||||||||||||||||||||||||||||||||||||||||||||||||||||||||||||||||||||||||||||||||||||||||||||||||||||||||||
| Meath East | 31% | 31% | 10% | 17% | 10% | 1% | ||||||||||||||||||||||||||||||||||||||||||||||||||||||||||||||||||||||||||||||||||||||||||||||||||||||||||||||||||||||||||||||||||||||||||||||||||||||||||||||||||||||||||||||||||||||||||||||||||||||||||||||||||||||||||||||||||||||||||||||||||||||||||||||||||||||||||||||||||||||||||||||||||||||
| Meath West | 27% | 32% | 6% | 30% | 4% | 1% | ||||||||||||||||||||||||||||||||||||||||||||||||||||||||||||||||||||||||||||||||||||||||||||||||||||||||||||||||||||||||||||||||||||||||||||||||||||||||||||||||||||||||||||||||||||||||||||||||||||||||||||||||||||||||||||||||||||||||||||||||||||||||||||||||||||||||||||||||||||||||||||||||||||||
| Roscommon-Galway | 22% | 31% | 5% | 11% | 32% | 0% | ||||||||||||||||||||||||||||||||||||||||||||||||||||||||||||||||||||||||||||||||||||||||||||||||||||||||||||||||||||||||||||||||||||||||||||||||||||||||||||||||||||||||||||||||||||||||||||||||||||||||||||||||||||||||||||||||||||||||||||||||||||||||||||||||||||||||||||||||||||||||||||||||||||||
| Sligo-Leitrim | 32% | 24% | 3% | 29% | 11% | 0% | ||||||||||||||||||||||||||||||||||||||||||||||||||||||||||||||||||||||||||||||||||||||||||||||||||||||||||||||||||||||||||||||||||||||||||||||||||||||||||||||||||||||||||||||||||||||||||||||||||||||||||||||||||||||||||||||||||||||||||||||||||||||||||||||||||||||||||||||||||||||||||||||||||||||
| Tipperary | 23% | 21% | 7% | 10% | 38% | 0% | ||||||||||||||||||||||||||||||||||||||||||||||||||||||||||||||||||||||||||||||||||||||||||||||||||||||||||||||||||||||||||||||||||||||||||||||||||||||||||||||||||||||||||||||||||||||||||||||||||||||||||||||||||||||||||||||||||||||||||||||||||||||||||||||||||||||||||||||||||||||||||||||||||||||
| Waterford | 22% | 29% | 9% | 19% | 21% | 0% | ||||||||||||||||||||||||||||||||||||||||||||||||||||||||||||||||||||||||||||||||||||||||||||||||||||||||||||||||||||||||||||||||||||||||||||||||||||||||||||||||||||||||||||||||||||||||||||||||||||||||||||||||||||||||||||||||||||||||||||||||||||||||||||||||||||||||||||||||||||||||||||||||||||||
| Wexford | 29% | 26% | 10% | 11% | 23% | 0% | ||||||||||||||||||||||||||||||||||||||||||||||||||||||||||||||||||||||||||||||||||||||||||||||||||||||||||||||||||||||||||||||||||||||||||||||||||||||||||||||||||||||||||||||||||||||||||||||||||||||||||||||||||||||||||||||||||||||||||||||||||||||||||||||||||||||||||||||||||||||||||||||||||||||
| Wicklow | 17% | 31% | 8% | 19% | 24% | 1% | ||||||||||||||||||||||||||||||||||||||||||||||||||||||||||||||||||||||||||||||||||||||||||||||||||||||||||||||||||||||||||||||||||||||||||||||||||||||||||||||||||||||||||||||||||||||||||||||||||||||||||||||||||||||||||||||||||||||||||||||||||||||||||||||||||||||||||||||||||||||||||||||||||||||
|
Based on these constituency estimates and using a d’Hondt method to determine which party wins the seats in a constituency, the party seat levels are estimated as follows:
| FF | FG | LB | SF | OTH | GP | |
| Carlow-Kilkenny | 2 | 2 | 0 | 1 | 0 | 0 |
| Cavan-Monaghan | 1 | 1 | 0 | 2 | 0 | 0 |
| Clare | 2 | 1 | 0 | 0 | 1 | 0 |
| Cork East | 1 | 1 | 1 | 1 | 0 | 0 |
| Cork North Central | 1 | 1 | 0 | 1 | 1 | 0 |
| Cork North West | 2 | 1 | 0 | 0 | 0 | 0 |
| Cork South Central | 2 | 1 | 0 | 1 | 0 | 0 |
| Cork South West | 2 | 1 | 0 | 0 | 0 | 0 |
| Donegal | 1 | 1 | 0 | 2 | 1 | 0 |
| Dublin Central | 1 | 0 | 0 | 1 | 1 | 0 |
| Dublin Mid West | 1 | 1 | 1 | 1 | 0 | 0 |
| Dublin Fingal | 1 | 2 | 1 | 0 | 1 | 0 |
| Dublin Bay North | 1 | 1 | 1 | 1 | 1 | 0 |
| Dublin North West | 1 | 0 | 1 | 1 | 0 | 0 |
| Dublin Rathdown | 0 | 1 | 0 | 0 | 2 | 0 |
| Dublin South Central | 0 | 1 | 1 | 1 | 1 | 0 |
| Dublin Bay South | 1 | 2 | 0 | 0 | 1 | 0 |
| Dublin South West | 1 | 1 | 1 | 1 | 1 | 0 |
| Dublin West | 2 | 1 | 0 | 0 | 1 | 0 |
| Dun Laoghaire | 1 | 2 | 0 | 0 | 1 | 0 |
| Galway East | 1 | 1 | 0 | 0 | 1 | 0 |
| Galway West | 2 | 1 | 0 | 0 | 2 | 0 |
| Kerry County | 1 | 1 | 0 | 1 | 2 | 0 |
| Kildare North | 1 | 1 | 1 | 0 | 1 | 0 |
| Kildare South | 2 | 1 | 0 | 0 | 0 | 0 |
| Laois | 1 | 1 | 0 | 1 | 0 | 0 |
| Offaly | 1 | 1 | 0 | 0 | 1 | 0 |
| Limerick City | 2 | 2 | 0 | 0 | 0 | 0 |
| Limerick | 1 | 2 | 0 | 0 | 0 | 0 |
| Longford-Westmeath | 2 | 2 | 0 | 0 | 0 | 0 |
| Louth | 1 | 1 | 0 | 3 | 0 | 0 |
| Mayo | 1 | 3 | 0 | 0 | 0 | 0 |
| Meath East | 1 | 1 | 0 | 1 | 0 | 0 |
| Meath West | 1 | 1 | 0 | 1 | 0 | 0 |
| Roscommon-Galway | 1 | 1 | 0 | 0 | 1 | 0 |
| Sligo-Leitrim | 2 | 1 | 0 | 1 | 0 | 0 |
| Tipperary | 1 | 1 | 0 | 0 | 3 | 0 |
| Waterford | 1 | 1 | 0 | 1 | 1 | 0 |
| Wexford | 2 | 2 | 0 | 0 | 1 | 0 |
| Wicklow | 1 | 2 | 0 | 1 | 1 | 0 |
| STATE | 50 | 49 | 8 | 24 | 27 | 0 |
These estimates also need to take account of the candidate and competition trends unique to the different constituency. Amending the model to account for seats that may be won or lost on the basis of estimates here being based on support levels derived due to a large/small number of candidates contesting the election in 2011 (as in the large number of independent candidates competing in constituencies such as Wicklow or Laois-Offaly in 2011) or one candidate polling especially well in that election (e.g. the Shane Ross vote in Dublin South/Mick Wallace vote in Wexford) in a manner that would not amount to an extra seat for another member of the same party/grouping. Vote transfer patterns and vote management issues (e.g. discrepancies between votes won by party front runners and their running mates which would see potential seat wins fall out of a party’s hands) also need to be accounted for. Taking these concerns into account, the amended seat allocations across the constituencies would look more like this:
| FF | FG | LB | SF | OTH | GP | |
| Carlow-Kilkenny | 2 | 2 | 0 | 1 | 0 | 0 |
| Cavan-Monaghan | 1 | 1 | 0 | 2 | 0 | 0 |
| Clare | 2 | 1 | 0 | 0 | 1 | 0 |
| Cork East | 1 | 1 | 1 | 1 | 0 | 0 |
| Cork North Central | 1 | 1 | 0 | 2 | 0 | 0 |
| Cork North West | 2 | 1 | 0 | 0 | 0 | 0 |
| Cork South Central | 2 | 1 | 0 | 1 | 0 | 0 |
| Cork South West | 2 | 1 | 0 | 0 | 0 | 0 |
| Donegal | 1 | 1 | 0 | 2 | 1 | 0 |
| Dublin Central | 1 | 0 | 0 | 1 | 1 | 0 |
| Dublin Mid West | 1 | 1 | 1 | 1 | 0 | 0 |
| Dublin Fingal | 1 | 2 | 1 | 0 | 1 | 0 |
| Dublin Bay North | 1 | 1 | 1 | 1 | 1 | 0 |
| Dublin North West | 1 | 0 | 1 | 1 | 0 | 0 |
| Dublin Rathdown | 1 | 1 | 0 | 0 | 1 | 0 |
| Dublin South Central | 0 | 1 | 1 | 1 | 1 | 0 |
| Dublin Bay South | 1 | 2 | 0 | 0 | 1 | 0 |
| Dublin South West | 1 | 1 | 1 | 2 | 0 | 0 |
| Dublin West | 2 | 1 | 0 | 0 | 1 | 0 |
| Dun Laoghaire | 1 | 2 | 0 | 0 | 1 | 0 |
| Galway East | 1 | 1 | 0 | 0 | 1 | 0 |
| Galway West | 2 | 1 | 0 | 0 | 2 | 0 |
| Kerry County | 1 | 1 | 0 | 1 | 2 | 0 |
| Kildare North | 1 | 1 | 1 | 0 | 1 | 0 |
| Kildare South | 2 | 1 | 0 | 0 | 0 | 0 |
| Laois | 1 | 1 | 0 | 1 | 0 | 0 |
| Offaly | 1 | 1 | 0 | 0 | 1 | 0 |
| Limerick City | 2 | 2 | 0 | 0 | 0 | 0 |
| Limerick | 1 | 2 | 0 | 0 | 0 | 0 |
| Longford-Westmeath | 2 | 2 | 0 | 0 | 0 | 0 |
| Louth | 1 | 2 | 0 | 2 | 0 | 0 |
| Mayo | 1 | 3 | 0 | 0 | 0 | 0 |
| Meath East | 1 | 1 | 0 | 1 | 0 | 0 |
| Meath West | 1 | 1 | 0 | 1 | 0 | 0 |
| Roscommon-Galway | 1 | 1 | 0 | 0 | 1 | 0 |
| Sligo-Leitrim | 2 | 1 | 0 | 1 | 0 | 0 |
| Tipperary | 1 | 1 | 0 | 0 | 3 | 0 |
| Waterford | 1 | 1 | 0 | 1 | 1 | 0 |
| Wexford | 2 | 2 | 0 | 0 | 1 | 0 |
| Wicklow | 1 | 2 | 0 | 1 | 1 | 0 |
| STATE | 51 | 50 | 8 | 25 | 24 | 0 |
| % seats | 32.3 | 31.6 | 5.1 | 15.8 | 15.2 | 0.0 |
Based on these seat estimates, a Fine Gael-Labour (combined seat level of 58 seats) would fall well short of the number of seats required to form a government (79 seats), but a Fianna Fail-Sinn Fein (combined seat level of 76 seats) would fall very close to this level. To have a sufficient number of seats required to command a majority in Dail Eireann (79 seats in a 158 seat Dail, assuming a deputy from another party/grouping takes on the Ceann Comhairle role), a Fianna Fail-Sinn Fein alliance would only need the support of three, or more, TDs from the Independent ranks or from political grouping to be able to form a government. A Fine Gael and Sinn Fein pairing (75 seats) would similarly fall a few seats short of the number required to command a bare majority in Dail Eireann, although such an alliance looks to be unlikely in the present political climate in any course. A Fianna Fail-Fine Gael coalition government would be another viable two-party coalition and such an alliance would command a very strong Dail majority (with a combined seat level of 101 seats).

The Labour figure of 10% in this Red C Poll is approximately equivalent to the recent poll figure of 8% in Millward Brown (Sunday Independent). I have shown this in my comment “How Red C disproportionately elevates the Labour Party in Polls”. See: https://politicalreform.ie/2013/08/17/so-what-for-silly-season-politics-looking-at-the-august-opinion-polls/#comments
Adrian Kavanagh, on politicalreform.ie, has also remarked that the Labour score in Red C polls is persistently higher than in other Polls
When Adrian Kavanagh distributed seats based on the 8% score in Millward Brown, he allocated only 3 seats to Labour!
There is a “tipping point” towards virtual exstinction for Labour as its score dips just below 10% (See Adrian Kavanaghs Analysis on Politicalreform.ie yesterday).
The degree of information given in SB post with the poll to-day is very minimal.
There is no regional breakdown, no figure for confidence in party leaders, no figure for satisfaction with government, no “raw” data
It puts “undecideds” at 18%. I assume that this is after 10 percentage points have been discarded on the grounds that they are unlikely to vote as is usual with Red C. Those not expressing a preference in the MB poll came to 37%.
Interestingly, it puts the figure for actual independents at a “reduced” 16% out of the 23% for “Independents and others”. I assume that this means that the total for Greens, Workers and Unemployed Action, People before Profit, Socialist Party, Workers Party and other registered small parties is 7%!
Pingback: The latest polls: A strange sort of stability. | The Cedar Lounge Revolution