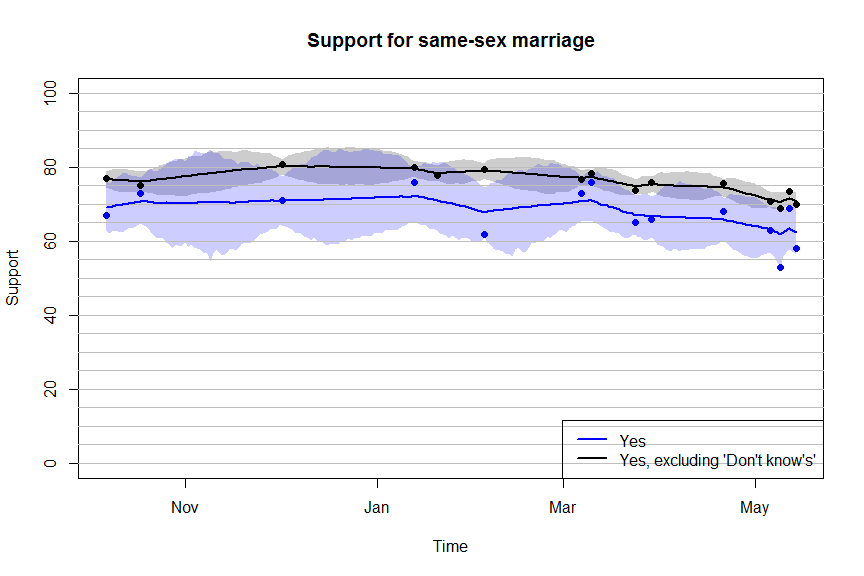
An ‘average’ of polls (line with 95% uncertainty interval shaded) and individual polls as dots for the marriage referendum
Four polls were published on the marriage equality referendum last weekend. These showed large differences in the expected yes-vote, ranging from 53% to 69%. Given that these polls were taken in roughly the same period, what do such large differences tell us about popular support for the proposal? How big is the decline for a ‘yes’ vote and how narrow will its majority be?
- Big differences between polls are due to undecided voters
While the four polls are very different in some respects, the are actually quite similar when we exclude the undecided voters. In the figure above, the black dots representing yes-support in polls after excluding undecided voters, are quite close at between 70 and 75%. The black line and uncertainty interval represents the ‘poll average’ and shows not too much uncertainty, reflecting the relative agreement among pollsters. Of course, this assumes that the polls are right and that undecided voters will stay at home or break down exactly as decided voters – which pollsters suggest is unlikely.
So it is perhaps better to look at the yes support among all voters, including undecided voters, to gauge the yes support. This is represented by the blue line which has a much larger uncertainty interval, due to hugely different polls. This suggests that yes support is between 60 and 70 per cent, even if we assume that the polls measure support accurately.
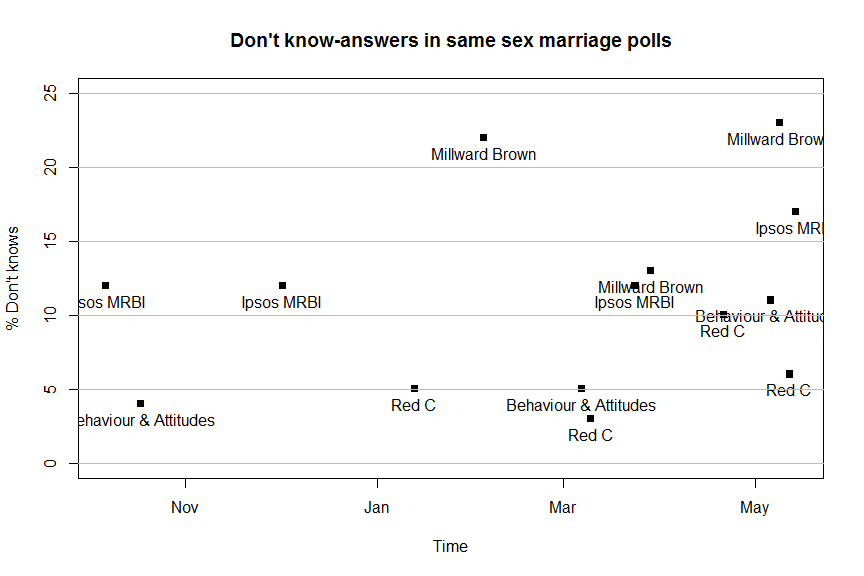
- The share of undecided voters seems to be going up rather than down
If we just plot the share of undecided voters in each poll since October 2014, we see somewhat of an increase. At first this seems puzzling: as the referendum draws nearer, would not more people decide upon their vote? In reality people are known to be polite and answer survey questions, even though they have not really thought about the matter. When the debate on the referendum started, more and more people started hearing arguments from both sides which perhaps made them more aware of the choice and its consequences. Those who supported (or opposed) equality before, might have moved towards being undecided.
- There are structural differences in the percentage of undecided voters between pollsters
The Red C polls generally show a much lower level of undecided voters than those of other pollsters, especially Millward Brown. There might be different reasons. First, the method of conducting the poll might play a role with people more likely to state their opinion in the Red C telephone polls than in face-to-face interviews (mostly) of other pollsters. That might also explain why B&A’s March poll (telephone) showed fewer undecided than their May poll (face-to-face).
Second, the exact question might have an impact as well, especially whether respondents are asked about a referendum tomorrow or a referendum on the 22nd of May. And third, whether explicit or implicit ‘don’t know’ options were offered to respondents.
- If the yes vote turns out, they do not need the undecided
Even if all undecided voters were to vote no, current polls suggest that the yes vote will carry the vote with about 60-70%. While in other referendums the actual result was much closer than early polls suggested, in fact late polls (1-2 weeks before the election) in the divorce referendum campaign showed a very close race. Similarly, Senead polls showed the yes-side on less than 50% (including undecided voters) the week before the election. These figures are better now for the yes-side.
Much will depend, however, on mobilizing voters with the yes campaign relying more heavily on categories of voters who are less likely to turn out in elections. If they can mobilize their vote, they should be able to win, albeit probably with a margin that is considerably smaller than early polls suggested.
Technical note: the average of polls was calculated using a similar method as used for the Irish Polling Indicator. I do not estimate ‘house effects’ because the number of polls per company is very low.

This referendum wil be defeated by 51% against 49% in favour. When people are asked do you support the “yes” campaign only a masochist would say they don’t. Look around for every person wearing a “yes” badge there are huge numbers who refuse to display an emblem. What does that tell you about the silent, browbeaten majority?